How to Spot Buying Interest in Candles
60sPractical, visual explanation of candlestick patterns that traders can immediately apply.
▶ Play Clip"An extremely brief clip (30 seconds) with ambiguous price action description; not a full trading strategy, just a few candle observations."
This transcript provides a detailed technical analysis of price action using candlestick patterns, focusing on identifying buying signals, breakouts, and consolidation levels in financial markets. The speaker emphasizes the importance of observing specific candle characteristics, such as strong bullish candles, lower wicks, and upper wicks, to predict market movements and entry points.
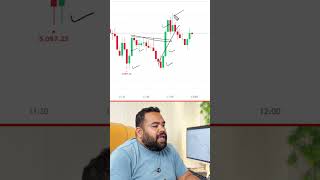
The speaker instructs to observe each candle carefully, noting that a strong buying candle started forming at a specific level. This candle shows a strong bullish presence with a significant lower wick and a strong closing.
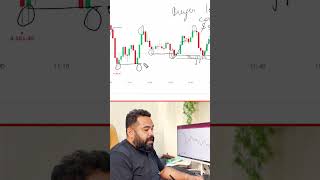
After the buying candle, the market consolidates around that level and then drops. It later breaks back through that same level, indicating a breakout. The speaker highlights strong buying during this breakout phase.
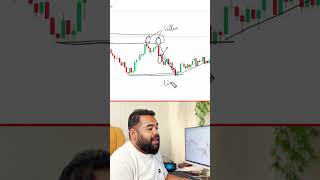
Following the breakout, the price forms an upper wick, suggesting potential resistance or profit-taking. However, the speaker notes the market subsequently rallies strongly upward from that level, showing continued bullish momentum.
The speaker uses candle patterns to identify key support/resistance levels and predict market movement, emphasizing buying strength after a breakout and the significance of upper wicks.
What does a strong bullish candle with a lower wick typically indicate?
It indicates strong buying interest at that level, with buyers stepping in to push prices up.
What happens to price after consolidation around a breakout level in this transcript?
The price breaks out higher, with strong buying volume.
00:15
What is the significance of an upper wick after a breakout?
An upper wick often signals resistance or profit-taking, but in this case the market resumed its upward rally.
00:30
What pattern indicates strong buying interest at a specific level?
A candle with a long lower wick and strong bullish close.
Bullish Candle Formation
Provides a visual pattern (strong candle, lower wick) that can be used to identify buying pressure.
Consolidation and Breakout
Demonstrates how a level of support/resistance can be tested and broken, a key concept in technical analysis.
00:15Upper Wick as Weakness then Rally
Illustrates that an upper wick after a breakout can be temporary profit-taking, not necessarily a reversal.
00:30[00:00] यहाँ पे एक-एक candle को आप ध्यान से देखना, market में इस candle से buying आनी शुरू हुई, यहाँ पे strong candle बनी, यहाँ पे lower wick बनी, अब market इसी level से consolidate करते हुए नीचे गिर गया, market ने वापिस इस level को breakout भी दिया है, अब यह देखो, strong buying आई इस पूरे breakout में, अब इसने जो upper wick form किया न,
[00:30] अब यहां से पार्केट वापिस से स्ट्रॉंगली उपर करा जाए


⚡ Saved you 0h 00m reading this? Transcribe any YouTube video for free — no signup needed.