
How One Trade Fakes Volume
58sUses a clear, relatable example to reveal a hidden truth about trading volume that most beginners misunderstand.
▶ Play Clip"Title promises the truth about volume, and the video delivers a thorough, honest explanation of what volume does and doesn't show."
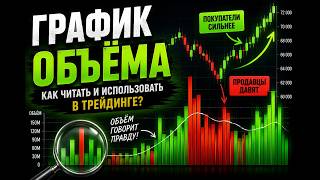
This video explains what trading volume is, how it is calculated, and how to interpret the volume indicator on price charts. It debunks common myths and demonstrates that volume alone does not predict price direction but reflects market activity.
The video opens by asking what the colored bars under price charts mean, why they vary in size, and whether they can be used to make money.
Volume represents the total amount of asset (e.g., bitcoins) transferred from sellers to buyers in a given period. It does not show number of buyers or transactions.
Using a simplified order book with one bitcoin per price level, buying the cheapest offers removes them, raising the market price. Multiple buyers can push price up.
Each transaction of one bitcoin adds one to volume. A single buyer buying 10 bitcoins at different prices creates 10 transactions and volume of 10, moving price up.
A seller places a limit order for 10 bitcoins at $50k. A buyer buys all with one market order. Volume is 10 but price does not change, showing high volume can occur without price movement.
Volume bars correspond to each candle. Color indicates candle direction (green if close > open, red if close < open), but color alone is not useful for analysis.
TradingView displays volume data from the specific exchange whose chart is open. Different exchanges have different volumes due to separate transaction records.
Volume must be analyzed together with price and support/resistance levels. High volume alone does not indicate direction; it shows activity.
The myth that rising price with falling volume signals reversal is not always true. Examples show price can continue rising on low volume.
Volume is not a signal generator. It helps understand market activity but does not predict price direction. Experienced traders use delta and volume profile for deeper analysis.
Volume is a measure of trading activity, not a predictor of price direction. It should be used alongside other analysis tools to understand market context.
What does the volume indicator show?
The total amount of asset transferred from sellers to buyers in a given period.
04:10
Does volume indicate the number of buyers or transactions?
No, it shows the total amount traded, not the number of buyers or transactions.
04:10
Why can high volume occur without price movement?
A single large trade at a fixed price (e.g., a limit order) creates high volume but no price change.
03:03
What does the color of a volume bar indicate?
It matches the candle color: green if candle closed above open, red if closed below. It does not indicate buying vs selling.
05:34
Does TradingView calculate volume itself?
No, it displays volume data from the specific exchange whose chart is open.
06:02
Why do volumes differ between exchanges?
Each exchange only records its own transactions, and volumes are not equalized across platforms.
06:30
What is the main takeaway about using volume in trading?
Volume is an additional tool to understand market activity, not a signal generator for price direction.
10:54
High Volume Without Price Movement
Illustrates that volume alone does not cause price change; context matters.
03:03Debunking Volume Myth
Challenges common belief that falling volume with rising price signals reversal.
08:05Volume as Additional Tool
Emphasizes that volume is not a standalone predictor but a contextual indicator.
10:54[00:02] opened the price chart, you noticed these multi-colored bars underneath it. But what do they mean anyway? Why do they sometimes become huge and sometimes almost disappear? And most importantly, can you make money with them? In this video, we'll
[00:16] explore what a volume indicator is, how it works, what it shows, and whether it's worth using in your trading. And finally, I’ll tell you whether it’s even possible to trade based solely on
[00:29] to trade based solely on volumes. Let's go. But before you look at price charts and look for any signals, you need to understand one of the most important things in trading. What is volume? Let's use animation as an example
[00:42] to see how price growth occurs and how it is related to volume. For simplicity, let's imagine that only one bitcoin is sold in the order book at each price level . The first owner sells bitcoins for
[00:55] $50,000,000, the next for $51,000, then $52, $53, and so on. You come and buy bitcoins for $50,000. This cheapest offer is disappearing. And now for the next buyers the minimum price will be
[01:10] $51,000. After this, two more people come and buy one bitcoin each. As a result, the cheapest offers of As a result, the cheapest offers of $51,000 and $52,000 also disappear. And
[01:22] now the lowest selling price is already $53,000, and the market price will be $52,000. Let's say you now want to sell your Bitcoin. You can list it for $60,000 or $70,000, but
[01:37] that doesn't mean anyone will ever buy it at that price. In order for the price to reach your offer, buyers must first buy out all the lower bids that are in front of you. But let's imagine that you have a
[01:49] bloody nose and you need money right now. Then you put your Bitcoin up for sale at $52,000. If there are no other sellers ahead of you at this price, best one, and the likelihood that it will be bought first will be significantly higher.
[02:04] Now comes the most interesting part. Volume. Let's imagine that each such transaction is carried out for exactly one bitcoin. If only one such transaction took place in a day, then the trading volume would be, [music] right, one bitcoin. If
[02:18] there are two transactions for one bitcoin, the volume will already be two bitcoins. If there are five transactions, then the volume for the day will be five bitcoins. Now let's imagine this situation. One large buyer appears who wants to buy
[02:32] 10 bitcoins at once. He places a market order and begins to buy out all the cheapest offers one by one. If only one bitcoin is sold at each level , the order is executed at ten different prices from $50 to $59,000.
[02:48] In this case, the exchange records 10 separate transactions, and the total trading volume for the period is 10 bitcoins, and the real price of bitcoin rises to $59,000. Note that there was only one buyer, but there were many transactions, and
[03:03] each of them moved the price up. Now let's imagine the opposite situation. Let's say one seller places a large limit order to sell 10 bitcoins at a time at a fixed price of $50,000. Then one buyer comes and
[03:17] buys out this entire volume with one market order. What is the result? The trading volume is back to 10 bitcoins, but the price hasn't changed at all. It remained at 50
[03:30] because all 10 bitcoins were bought at the same price, $50,000. This is why high volume in history does not always mean a strong price movement. It could have been just one big trade within a
[03:42] horizontal flat. This is why it is very important to understand one thing. Volume alone does not determine price. The price changes because buyers buy out the sellers' cheaper offer, or sellers begin to agree to
[03:56] sell cheaper. But the volume indicator shows something completely different. It does not show the number of buyers, it does not show the number of transactions, it shows the total amount of bitcoins that passed from sellers to
[04:10] buyers over the selected period of time. Simply put, it shows how actively participants traded during a given period. And that is why high volume does not mean that many new people have entered the market. It
[04:24] could very well be one big player who made a very big deal. Bitcoin chart and see what this indicator looks like in practice and how to read it correctly. To enable it, open the indicators menu.
[04:39] We enter the word volume or volum in English and select the most common indicator from the list . After this, columns like these appear under the price chart . Each column
[04:53] corresponds to one candle. If you have an hourly chart open, one bar shows the trading volume for 1 hour. If a fifteen-minute chart is open, the volume will already be for 15 minutes. That is, each column always refers to its own candle.
[05:08] On the right there is a scale with volume values, but it is very inconvenient to constantly move your eyes to it. It's much easier to just hover your cursor over the desired bar, and in the upper left corner you will see the exact volume value for that candle. Now let
[05:22] 's pay attention to the color. If the candle is green, then the bar will usually be green too. If the candle is red, then the bar remains red. But here many beginners make the wrong conclusion. It seems as if the green bar
[05:34] means that everyone was buying and the red bar means that everyone was selling. But in reality this is not the case. There are always two sides to any transaction . If someone bought bitcoins, it means that someone sold them at the same moment. Without a seller there is no
[05:48] buyer and vice versa. Therefore, the green color of the bar means that the candle just closed above the opening price, and the red color means that the candle closed below. The color itself carries virtually no useful information for analysis.
[06:02] Moreover, in the indicator settings, you can make all the bars the same color, for example, gray, without losing anything. Now there is one more important point. Many people think that Trading View calculates trading volumes itself, but this is not
[06:16] true. Trading View simply displays data from the exchange whose chart you have open. For example, if you open a Bitcoin USDT chart on the Bybit exchange, the volumes will only be shown for those transactions that took place on the Bybit exchange.
[06:30] If you open the same Bitcoin on an exchange, say, Binx, the volumes will be a little different. Why? Because each exchange only takes into account its own transactions. Due to arbitrage, prices on different exchanges are usually very similar. If
[06:44] , it quickly starts to be bought and sold on another platform, and the price levels out again. But the volumes do not have to be equalized. The same applies to the spot market with futures. Real bitcoins are traded on the spot.
[07:00] and on futures contracts at this price. Therefore, the volumes in these markets may also differ significantly. So you should already gradually understand that if the price is the same everywhere, the volumes are different, which means that the results will be different on different charts
[07:14] . Now the main question arises: how to use these posts at all ? The most common mistake beginners make is looking only at the volumes themselves. In fact, volume is always analyzed together with price. A high
[07:27] bar in itself does not indicate either growth or decline. It just shows that a lot of bitcoins passed through the market at that moment . Likewise, low volume does not mean that the price will necessarily reverse or stay the same. It
[07:40] only says that trading activity is now lower than it was before. Therefore, we will now look at real examples on the chart and see what can really be understood from this volume, and what conclusions should not be drawn.
[07:53] support and resistance levels on the chart. It is precisely together with them that the volume indicator can provide much more information about what is happening in the market. But before I continue, I want to dispel a very
[08:05] popular myth. You've probably heard somewhere that if the price rises and the volume falls, then a reversal will soon occur. And if the price rises and the volume also rises, then there will be a breakout of the level. Sounds beautiful, I agree. But in practice, things are
[08:20] far from so simple. Let's look at an example on a graph. Here is the first section of this graph. And the price gradually approached the resistance zone. There were no abnormal volumes on the way up , and we did not observe anything. Then
[08:34] the market moved flat for some time, and volumes gradually decreased. Do you see? What does this mean? This indicates that trading activity has gradually decreased, with buyers and sellers making fewer transactions. Can we
[08:48] conclude from this that the resistance will definitely not be broken through? No, I can only accompanied by an increase in trading activity, which means that if a breakout occurs, I personally will treat it a little more cautiously and wait for better
[09:04] Then the price returns to support. As the volumes decrease, they also begin to decrease. This does not necessarily mean that the market will turn up, but it may indicate that selling pressure is gradually weakening. And
[09:18] now the most interesting thing happens. The price begins to rise sharply towards resistance and at the same time the largest volume in recent times appears. This surge indicates that trading activity has increased sharply near the level. It is at
[09:31] this point that the market really begins to fight for a breakout. After this, the price consolidates above the resistance. In such a situation, high volume becomes additional confirmation that the breakout looks more convincing. Well,
[09:45] in this particular case it was a false breakout on the news and the price came back. Now let's look at another section of the graph. The situation here is very similar. The price is approaching resistance again, but the volumes are completely
[09:59] different. The breakout occurs without any significant increase in trading activity. And what do we see next? the price still continues to move upward. This is why I do not advise you to trade based only on volume.
[10:13] If you look at the chart history, you can find dozens of examples where low volume after a price decline was followed by a strong rise. This blue line is a moving average of volume. It can also be enabled in the settings and
[10:26] configured. I have it by default. So, you see, when the price starts to fall and at the same time the volume falls and trades for some time at one level below the moving average, then the price soon starts to rise again. But you
[10:40] can also find many situations where the market went down after such small volumes. Therefore, it is necessary to understand the context of the market situation. What is the trend, where are the support and resistance levels, and what do
[10:54] the indicators say? Therefore, I personally do not know a single trader who makes his decisions based solely on volume. This indicator is not a signal generator. It is rather an additional tool that helps to better understand what is
[11:06] happening in the market. It doesn't answer the question of where the price will go, but rather how actively market participants are trading right now. And these are two completely different things. If you want to dig deeper, experienced traders often look
[11:20] not just at volume bars, but at what's called delta. This is the difference between aggressive buying and selling within this volume. There is also a very popular volume profile indicator, which shows where
[11:33] trades were actually made and where it seems to us. But this , as you understand, is a topic for a separate video. And today we dismantled the base, without which it would be useless to go there. Well, the main conclusion of this video is very simple. Now you know what volume is, how it is
[11:49] calculated and what exactly this indicator shows. You now understand that it does not show the number of buyers and does not show the number of transactions and, even future. But it does show how actively the market was trading at a
[12:03] certain point in time. And even if after watching this video you decide not to use volume in your trading at all, you will still have a better understanding of how the market works. And any understanding of the market is already a step forward compared to
[12:15] most newcomers, and your guys from the neighborhood. So subscribe to the channel if you want to see more trading videos like this . Don't forget to support this video by liking and commenting below
[12:28] contains links to the crypto exchanges I trade on. By registering through them, you are guaranteed to receive discounts on trading commissions and registration bonuses. Thanks everyone for watching. Good luck with your trading, everyone. Bye.
⚡ Saved you 0h 12m reading this? Transcribe any YouTube video for free — no signup needed.