
How to Trade Bitcoin: 3 Scenarios
60sProvides actionable trading scenarios, appealing to traders seeking practical strategies and educational value.
▶ Play Clip"The title promises live trading and exact moves, and the video delivers on that with detailed chart analysis and trade setups, though it includes some filler and self-promotion."
In this live trading session, the host analyzes Bitcoin's price action using yearly, monthly, and 12-hour charts, predicting a drop to $44,000 based on a fair value gap. He also reviews trades on Ethereum, Solana, and XRP, and discusses macroeconomic factors like the NFP and CPI data, as well as Goldman Sachs' forecast on rate cuts.
The host reiterates his prediction that Bitcoin will drop to $44,000, based on a fair value gap on the yearly chart.
He explains the yearly chart, showing that the only inefficiency (fair value gap) is between certain candles, which price needs to fill, targeting $44,777.
On the 12-hour chart, he identifies a series of consolidations and drops, suggesting price is meant to move down to a specific point, though it may take weeks of retracement.
Despite bullish sentiment, institutional data shows net outflows for most cryptos, with Solana being the only one with net inflows. This creates a divergence.
The NFP data signaled a very bullish dollar, which typically leads to declines in assets like Bitcoin, EUR/USD, and stocks.
The host warns that Wednesday's CPI data could cause further drops in Bitcoin, depending on the outcome.
Goldman Sachs pushed the possibility of a rate cut to 2027, which supports the bearish outlook for Bitcoin. He suggests DCA (dollar cost averaging) only when rate cuts begin.
He outlines three scenarios for Bitcoin: a retracement to a supply zone and drop, a sweep and drop, or a break above with a retracement to go long.
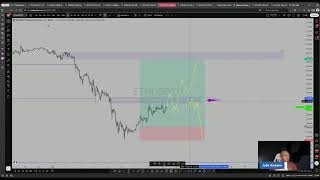
For Ethereum, he identifies a break of structure (BOS) and uses Fibonacci retracement to plan a short from a supply zone, with two possible scenarios.
Solana had record ETF inflows last week. He placed a limit order for a retracement to a zone but didn't get an entry; the target remains a region for a short.
XRP shows a similar break of structure, with a golden zone as a target for a short position, but he also didn't get an entry.
He announces that a copy app tester will be available for download by tomorrow, with a beta launch expected by the end of the month.
The host emphasizes trading based on price action and data, not sentiment, and advises waiting for confirmation before entering trades. He also highlights the importance of macroeconomic events like CPI and rate cuts in shaping Bitcoin's trajectory.
What is the fair value gap on Bitcoin's yearly chart, and what price does it target?
The fair value gap is an imbalance between candles, targeting $44,777.
04:53
Which cryptocurrency had a net inflow last week?
Solana had a net inflow last week.
11:36
What does Goldman Sachs predict about rate cuts?
Goldman Sachs pushed the possibility of a rate cut to 2027, expecting no rate cut this year.
14:22
What is DCA in trading?
DCA stands for dollar cost averaging, which is buying in increments over time.
14:49
What are the three scenarios for Bitcoin's next move?
1) Retracement to a supply zone and drop, 2) Sweep and drop, 3) Break above with retracement to go long.
18:22
Fair Value Gap on Yearly Chart
Provides a concrete price target based on market inefficiency, a key technical analysis concept.
04:53Divergence Between Sentiment and Data
Highlights the importance of looking beyond market sentiment to institutional flows.
10:31Goldman Sachs Rate Cut Forecast
Macroeconomic forecast that directly impacts Bitcoin's bearish outlook.
14:22Three Trade Scenarios for Bitcoin
Illustrates a structured approach to trading with clear conditions for each scenario.
18:22[03:40] doing? I hope you had a good night rest. We're getting into the chat. Today, we Um If you look at the chart, >> [clears throat] >> I've been saying that
[03:54] Bitcoin is going to drop to 44,000. I made a video about this. I've said it in multiple lives. And happen. But
[04:06] we are seeing a lot of it. So, I'm going to go back in time. Okay? I'm going to go back in time. So, let me Let's start from the 12-month chart. This is the yearly chart. I want to tell you guys how I came about
[04:19] Okay? If you're looking at this, this is the If you're looking at this, this is the Bitcoin yearly chart. And over here you can see this particular
[04:39] this particular blue line, this one. Then this other blue line. If you look at the candle structure, we've been having a very efficient movement. The only inefficiency
[04:53] that is the fair value gap, >> [cough and clears throat] >> that is imbalance that we have, is this one here. So, price needs to
[05:06] come down and fill this region. Okay? Fill it Price just needs to come down and fill that region.
[05:18] And that brings us to 44,000 777. So, price may come down even up to 40,000. Possibly. I'm not giving you a guarantee But this is what the chart shows. And it happens.
[05:41] Oh, my chart is not showing. Okay. Let me go over it again. 44,000. And I just want to show you how I came about that. This is a This is a yearly chart. And each candle represents what happened
[05:55] in one year. Okay? 1 2 3 4 5 6 7. Okay? 1 2 3 4 5 6 7. 1 2 3 4 5 6 7 at least 7 year candle. And what you will see is that you see this
[06:09] yellow line that we have here? This I mean not the yellow line, the Okay? This is the bottom of candle. Okay?
[06:24] this one is the high of I mean This one is the high of the 2023 And
[06:38] movements. The only inefficiency is a gap between this one and this one. This is a fair value gap. This is an imbalance. This is the inefficiency in this price action. So it is expected that price comes and
[06:55] So it is expected that price comes and fill that gap. expected that price comes down and fill that gap.
[07:07] Okay? Before we see it moving up. Now I'm not giving guarantee that this what the This is what price is saying. Somebody is saying there's no chart on
[07:21] Please, can you confirm? Every other person, can you confirm that you can see my chart? that there's no charts on my screen. I just need confirmation from
[07:37] any other person that my charts can be seen. Can my charts be seen? If my If you can see my chart, type one in the comments. If you cannot see my chart, type two in the comments.
[07:56] comments. If you cannot see it, type two in the comments. um if you're not seeing my chart, maybe it's probably from your end. All right?
[08:15] yearly chart. Now, let's look at the Now, let's look at the the monthly charts.
[08:27] And now, let's look at the the um 12-hour chart. I said, if you look at this 12-hour chart,
[08:39] here we had we got had a consolidation here. Okay? Then we moved down, had a consolidation here,
[08:52] moved down, had a consolidation here, we are meant to move down to this point. here. Okay? You can see price has gotten to
[09:05] this peak, this point. It has moved down up to here. movement. It's not going to happen immediately. We might see weeks of retracement before this happens.
[09:18] trade based on what price is saying. This is what I'm trying to This is where I see price going. But even if price doesn't do this, we trade based on what we have. In other words, if price does this, we do this. If it doesn't do this,
[09:33] uh if it doesn't do this, just wait till price does Um so if this then this, if this then this. That is actually how we trade.
[09:53] says Well, I see the 12-month charts. I don't know if there is more than one Okay. So we've left the
[10:05] 12-month chart. We're now in the 12-hour chart. So this is where we are. And price actually came down and hit 59,000. Now
[10:19] you know, it's time for for Bitcoin to start going it's time for for Bitcoin to start going up. Right now,
[10:31] uh the sentiment around cryptocurrency is bullish. If you watch the market it is bullish. But this now create a divergence because to buy Bitcoin. It's time to buy crypto now.
[10:47] Bitcoin. It's time to buy crypto now. But the actual macroeconomics and the actual data is showing a different thing. So you're going to learn something You're going to learn something today.
[11:02] to track institutional sentiment or performance or data. There is for last week, we still had a net outflow. More people are selling their Bitcoin
[11:18] than buying. MicroStrategy, you guys know MicroStrategy, also had to sell Bitcoin to pay I think they call it sell Bitcoin to pay I think they call it dividend.
[11:36] As a matter of fact, the only um crypto that had a net inflow last um crypto that had a net inflow last week is Solana. Solana had a net inflow. Then, if you look again, last week you have the NFP,
[11:50] yesterday uh in the yesterday live. We have that. And from that net outflow from from the
[12:02] from the uh NFP, the signal it gave is very
[12:14] what's it's very very very um comment. Okay. So,
[12:34] very bullish on the dollar. So, when the dollar is very bullish, it means that the dollar if the dollar goes up, most assets are going to come down. up, most assets are going to come down. EUR USD, um
[12:47] Bitcoin, the stock market, many of them are going to come down. Okay? If the sentiment is bullish on the dollar. This week, let me go to the Forex Factory. This week, you have to be on the lookout
[13:01] because on Wednesday we also have the CPI data. This might depending on what the what the CPI is, we can see further drop in the in in Bitcoin or not.
[13:16] Okay? Let me just give you a quick um on Discord yesterday, these are the trades that I dropped. Um we didn't get an entry in this one. But for GBP USD, uh we are currently in this trade. This
[13:29] is the trade we are right now uh on Discord. This is going as expected. The target is to take a short position on this point. But here we are long. Once we have
[13:42] another break and we trace and go up again, then I can break even on this trade to stay to stay to stay
[13:56] dropped this setup before I took it on Discord.
[14:10] so those who wants to buy Bitcoin, uh as Okay, one more news. um Goldman Sachs, right? That is the big bank.
[14:22] They have they believe that, you know, they have pushed the possibility of any rate cut to 2027. So, this year they're not expecting a rate cut.
[14:35] Which means this will also supports the bearish nature of Bitcoin. It's when you start seeing rate cuts that you can start doing a DCA into crypto into Bitcoin. DCA means dollar cost averaging. You start buying in
[14:49] Okay? Because you believe in the next maybe two two two years from when rate maybe two two two years from when rate cuts start coming that you might get a um that you you may get a 2x 3x your money.
[15:04] So, what I'm saying is that for sports traders, you want to start accumulating Bitcoin, you want to see Bitcoin do this from 50,000 it can start buying because long time. And before it now goes up and
[15:18] hits this and go above its all-time high for it to go only to go up, but it's not That is my own opinion anyway. It everything might just change. I'm seeing, this is what is happening.
[15:32] So, now and let's dive into the chart and see the trades that we can take. I on Bitcoin, but on um Solana and Ethereum and XRP. I'm going to also look into that. So,
[15:46] since we have broken this line this line here break I'm going to go to the 4-hour time frame. you know, enter this blue line we've been waiting
[16:00] for it. Yeah, it has been a target, but we hit it. What is the next possible move? Next possible move can is this. we can have a retracement into this region and we drop down.
[16:13] We drop further. Another one is that we can have a retracement into this region. This daily supply zone. I will drop down
[16:25] I don't know which one is going to happen, but to determine which is going for confirmation entries in this zone. That is why I have two of them um marked out. Either a retracement into this pocket
[16:40] a retracement into this zone, drop down, or a retracement into this particular zone and we drop down from there.
[16:52] from 4-hour, this is what I'm looking at. Then from here, I cannot go down to 1-hour time frame. Can I see more Um it's going to be quite difficult to trade crypto because you want to see
[17:06] meant to see. We're not seeing the structure we're meant to see. So, if you look from the 1-hour, So, if you look from the 1-hour, uh it's very it looks very possible that
[17:19] uh it's very it looks very possible that we see a drop from here.
[17:37] that it will drop from here. So, all I want to do now is just wait for the price action of Bitcoin in this region. If I see this in this region, then I can short from here.
[17:51] From this angle down. This is what I want to look for here. But, if it break above it, if you break above it with a sweep, then we can still go down. But, if it break above it with a candle
[18:07] body closure, then we can retrace and now go up. Then, from here, we can now look for a shift to go down.
[18:22] 1-hour, okay? Um, one is that we get to this region, look for confirmation, and take a short position, and go down.
[18:34] and take a short position, and go down. Target is this region. This one scenario. Second scenario is that we can have a Second scenario is that we can have a sweep. Sweep is when price just goes up,
[18:47] sweep. Sweep is when price just goes up, but doesn't close above the demand with a candle body closure, but rather a sweep. If you see that, there's still possibility that you can take an entry to take a
[19:01] short position to go down as well. The third scenario is price can break. Now, this one is sweep or break above this. Okay, when it break above this, what you
[19:13] want to look for is a retracement here to take an entry to go long to now target here because you can have a possibility of price now doing this from
[19:25] here to go lower. So, these are the possibilities I have with Bitcoin. Now, initially when I saw this, I was like, "Okay, let me look for a way to trade this from here to here." Just the way yesterday I I
[19:40] um that this is the region I want to short from. For that is for Forex. I said, "This is where I want to short from, right?"
[19:52] But I was like, "Okay, if I see opportunity to long it first here, I'm going to take it. Then when I get here, I will exit and So, the same thing for Bitcoin. When I looked at this, I was like, "Okay, um
[20:06] is there opportunity for me to enter here?" Then I went down to the 5-minutes I didn't like the setup I was seeing, okay? So, this trade was not taken by me because I just didn't like the
[20:19] So, for Bitcoin, this distance, this is still where I want to be looking at um trades from this region. So, what I I do is to mark this region. You can see
[20:34] region. So, when price gets here, I want to come and start looking for entries on the 5-minutes time frame to take a short position. Then for Ethereum, this is a trade that I placed on Ethereum. It's just
[20:49] okay? Uh we had This is a proper break of structure here.
[21:06] BOS. So, if you have a BOS, what do you expect? You want to see a retracement. And usually what I do is to take a Fibonacci from this zone. Then, I want to see a retracement
[21:21] Then, I want to see a retracement from 62. But, I really doubt that price is going to come to the 62. Okay? Because price is just very, very bearish. What What I can do is maybe just start
[21:35] looking at the retracement from from uh the Fibonacci pulled either from
[21:48] Okay? Which aligns with my supplies on here or from this region. here or from this region. So, I'm taking it from here.
[22:00] looking at the way I trade, it's a supply zone. So, I'm expecting price to this region. Now, to go all the way to here. Okay? All the way to here before we see a price start going down
[22:16] But, looking at this, there's every possibility because if you look closer okay? We also have here a demand zone. A supply zone.
[22:32] So, price could simply get into this region here down from here. It's very possible it does that. But, if we have this demand that's why I keep saying trading is if this happened, then we do
[22:47] If this, then this. So, if we have this demand zone break above like this, keep on to have it keep on going here. So, here it determines. If I was in this
[22:59] trade already, maybe by this by because of this, I would have just breaking even not not knowing what is going to happen. So, Ethereum, this is it. This is it. I'm still going to I think they they clear a trade to me. For
[23:12] Ethereum, let me go back. For Ethereum, what is the possible trade For Ethereum, what is the possible trade I'm looking at? One is this. One is um
[23:25] we have a break above this. Okay? And look for opportunities to go long. scenario. The second scenario is
[23:40] if price comes here and gives a confirmation entry, okay? As simple as that. Then I'll go short from here. So, it's just a determining of the determining factor is what happens in this pocket.
[23:56] Does price break it or does price give confirmation to go to go low? For Solana, this is a trade I also um placed a limit order, but I didn't get an entry.
[24:16] expecting a retracement to this zone. I didn't get it, so um the trade is still on. So, and this is also the target. I'm going to go back to the 1-hour time frame.
[24:28] So, this is the target as well. The target is that target is that is at this region. It simply Solana, like I said, actually had a
[24:40] positive news last week. There was record out inflow from the ETF. So, um assistant Lana go all the way to this region, right? Then from here is
[24:54] where I'm looking for a short from from here. position from. But, if you don't get this, I won't just say that. If you don't get this, it's still okay. Sometimes, in a whole week,
[25:06] see a trade in a whole week, it's still fine. Because from here, if we still have if we have Solana do this, let's say from here, um Solana does this, it does like this,
[25:23] then this region becomes where I look for entry from to go lower. I'm not bothered about this region above anymore.
[25:37] here anymore. I'll just start looking for um positions here. But, as we stand, this is the trade that I have for Solana. I'm not in it because I didn't get in.
[25:51] For XRP, it's very very similar. For XRP, it's very similar. I also didn't And for XRP, it is also the break of structure that we have here.
[26:04] And um zone because I was able to This is structure I saw to make more sense. This is golden zone. This is the target I have, but I also didn't get an entry.
[26:20] I have, but I also didn't get an entry. So, for XRP, this is also the region I'm looking to see to take a short position to take a short position um from my Yes, do I have an alert here?
[26:32] alert here. So, these are the trades. Trades I couldn't get into yesterday. And then my plan. But, for XRP, I'm actually still positive. I'm not I've not removed this trade because if price
[26:45] still comes down to this region, trade. If it comes this way, because we are still um
[26:58] >> [snorts] >> Compared to all this. So, this is the setup we have. Um you guys know I've been talking about copy me for a while now. We are in the
[27:13] things and testing out some things. So, we're bringing a copy app tester. If you are in the WhatsApp group where we have the testers, just know that by tomorrow you should be able to download the app
[27:27] Um then end of the month, we are still we are still looking forward to launch as beta by the end of the month. So, um welcome guys again. I didn't get to
[27:43] ask where you are at sending the live from, again come next week Monday
[27:55] the same time. And mind you, I drop all these things I drop all my charts Discord, use the list in link in the description to get access to my Discord. Bye everyone. I'll see you guys.
[28:10] I might be holding a live um later this week, but you get to I'll drop it. You get to hear about it. You get to hear about it. Okay. Uh
⚡ Saved you 0h 28m reading this? Transcribe any YouTube video for free — no signup needed.