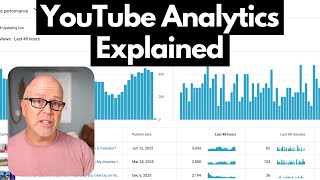

YouTube Analytics: What Really Matters
45sBeginners need to know which stats to focus on, and this clip promises to cut through the noise.
▶ Play Clip"Title accurately describes a beginner's guide to YouTube analytics; content delivers on promises."
This video explains YouTube analytics for beginners, covering which stats matter most, common mistakes, and hidden features. The creator emphasizes focusing on views, watch time, average view duration, and click-through rate, while avoiding obsession with real-time data.
Go to studio.youtube.com or click your avatar and select YouTube Studio. Analytics can be viewed for the whole channel or individual videos.
Shows total views, watch time, subscribers, and revenue (if monetized) for a selected time frame. The real-time window shows recent activity.
Access via content tab or analytics icon. Key stats: views, watch time, subscribers gained, and average view duration graph showing retention.
CTR measures how often impressions lead to clicks. A good CTR is better than your channel average. Improve with better thumbnails and titles.
Found under real-time analytics. Shows hourly views for top videos. Useful but can be addictive; avoid obsessing.
Use the gray shaded area in views/watch time graphs to see if a video outperforms or underperforms your typical performance.
Found under content analytics. Shows how viewers find your videos (browse features, suggested videos, search, external). Useful for understanding discovery.
Publish, then check analytics 24-48 hours later. Ask: Are people clicking? (CTR) Are they watching? (average view duration). Make one improvement per video.
In analytics > see more, select 'first 24 hours video performance' to see top and bottom performing videos by views, CTR, average view duration.
Add end screen element clicks and CTR columns to see which videos perform best on end screens.
Focus on making more content and improving gradually rather than obsessing over analytics. Volume and time will naturally grow your channel.
What are the two main ways to access YouTube Studio?
Type studio.youtube.com in your browser, or click your avatar on YouTube homepage and select YouTube Studio.
00:42
What is the most important stat for a video according to the video?
Total number of views.
05:37
What does the average view duration graph show?
It shows exactly when people are leaving your video, with dips indicating where viewers drop off and spikes indicating rewatches.
06:23
What is a good CTR according to the video?
A good CTR is one that is better than what you normally get for your channel.
09:41
What is the recommended time to wait before checking analytics after publishing?
24 to 48 hours.
19:35
What are the two simple questions to ask when analyzing a video?
Are people clicking on my thumbnail? (CTR) Are people watching my video? (average view duration)
19:47
What hidden stat shows top and bottom performing videos in their first 24 hours?
First 24 hours video performance, found under analytics > see more.
20:17
What is the main advice for beginners regarding analytics?
Don't obsess over stats; focus on making more content and improving gradually.
23:36
Average View Duration Graph
Shows exactly when viewers leave, enabling targeted improvements.
06:23Good CTR is Relative
Emphasizes comparing to your own average rather than arbitrary benchmarks.
09:41Comparing Videos to Channel Average
Uses gray shaded area to benchmark performance, a practical method for self-assessment.
14:17Check Analytics After 24-48 Hours
Prevents overreaction to early fluctuations and allows YouTube's algorithm time to work.
19:35Focus on Learning, Not Optimizing
Encourages beginners to prioritize skill development over metrics.
23:36[00:00] YouTube analytics or stats. They are
[00:03] crucial in understanding how well your
[00:06] videos are performing, but also your
[00:08] channel as a whole. In this video, I'm
[00:09] going to explain which stats are
[00:11] available to you, which ones are the
[00:12] most important to follow for beginners.
[00:14] I'll show you what my favorite stats
[00:16] are, what mistakes to avoid, and some
[00:18] hidden but super useful stats that I
[00:20] just found today. And when I say stats,
[00:23] I mean analytics. I use those two words
[00:25] interchangeably. It's important to point
[00:26] out that YouTube will often change the
[00:28] exact way you get to certain things in
[00:31] your YouTube studio as well as on the
[00:33] YouTube homepage. So, just know that
[00:35] what I'm showing you today is exactly
[00:37] the way you do this as of mid December
[00:39] 2025. Let's get into the analytics. So,
[00:42] you're going to go to YouTube Studio.
[00:44] So, you do that by either typing
[00:46] studio.youtube.com youtube.com into your
[00:48] browser. Or if you start from your
[00:50] YouTube homepage, you can go up to your
[00:52] avatar in the upper right, click on
[00:54] that, and then click YouTube Studio.
[00:56] Here, real quick, I want to mention
[00:59] today's sponsor, Nexus Clips. If you're
[01:01] a content creator and you're only
[01:02] posting long- form videos, you're
[01:04] leaving a lot of potential attention on
[01:06] the table. A lot of people discover
[01:07] creators today through short clips on
[01:10] shorts, Tik Tok, or reals, but keeping
[01:12] up with that can feel overwhelming.
[01:14] That's why I'm using Nexus Clips. It
[01:16] takes my long videos, finds the best
[01:18] moments, reframes them vertically, and
[01:20] adds animated subtitles automatically,
[01:22] which matters because a lot of people
[01:24] watch short form content without sound.
[01:26] It honestly removes the friction of
[01:28] clipping content, so sharing short form
[01:30] content daily actually becomes doable.
[01:32] Keep focusing your time on your long-
[01:34] form videos and use Nexus Clips for
[01:36] short form. If your content is already
[01:38] good, this is one of the best ways to
[01:40] grow your personal brand. Try Nexus
[01:42] Clips today. Now, let's get back to the
[01:44] video. Now that we're in YouTube Studio,
[01:46] I want to point out that there's two
[01:48] ways to look at your analytics. You can
[01:50] either look at them from a channel
[01:52] perspective, your channel as a whole, or
[01:54] you can look at the analytics of an
[01:56] individual video. To get to your channel
[01:58] analytics, you're going to go into the
[02:00] left menu here and click on analytics.
[02:03] From here, you start off on the overview
[02:04] page. And on that page, you can see the
[02:07] total number of views you've had for a
[02:09] given time frame. Okay? So, it's
[02:11] important to note that you can change
[02:13] the time frame in the upper right. See
[02:15] here where it says last 28 days, that's
[02:18] what it's showing this data for. If I
[02:20] want to change that, I can just click on
[02:21] it and select a different period. 7
[02:23] days, 90 days. As soon as you click on
[02:25] it, the stats will update. Now, you can
[02:27] also enter a custom date. So, click on
[02:29] custom here and then you can select your
[02:31] date range. And the first time you click
[02:33] will be the start of your period. So,
[02:36] let's say I want to start on November
[02:37] 4th and then I want to click on the end
[02:39] date. So, let's click on the 26th. Okay.
[02:41] And then you click apply. The stats all
[02:43] update. And now we can see that this is
[02:45] a custom date range from November 4th to
[02:47] the 26th. Okay. Let me just go back to
[02:49] last 28 days. And the stats update. Now,
[02:53] what we're seeing here is a summary and
[02:55] it also shows how much your channel
[02:57] usually gets. That's important. I'm
[02:59] going to talk about that a little bit
[03:00] later. The views. This graph here will
[03:03] show whatever you click, whichever tab
[03:05] you click here. Right now, you can see
[03:07] that the views tab is selected. So, it's
[03:10] showing views per day. Now, you can also
[03:13] see that uh there's some icons down
[03:14] here, and if you hover over them,
[03:16] they'll tell you what they are. So, this
[03:18] one, for instance, was a live stream
[03:20] that I did on that date, November 11th.
[03:23] And these are actually clickable. So, if
[03:25] I hover over this, I can come down here
[03:27] and I can click on that if I want to go
[03:29] and see more data on that specific
[03:32] video. Now, these are for the views.
[03:34] Okay? Okay, so you can see how many
[03:36] views I got in each day. And if you
[03:37] hover over, it'll show up. So 7,495
[03:41] views that day. Again, this is for the
[03:43] channel as a whole, not the individual,
[03:45] not any particular video. All right. If
[03:47] we want to see the watch time, we click
[03:48] on here. Now, this updates. Now it shows
[03:51] the watch time. You can see the number
[03:53] of subscribers you got per day. And
[03:55] then, of course, if you're monetized,
[03:56] you will see this fourth tab and the
[03:58] estimated revenue that you earn on each
[04:00] given day. Over here is the real time
[04:03] window, which I'm also going to cover in
[04:04] a little more detail a little later. Uh,
[04:06] and it'll show you how many subscribers
[04:09] you have, your real-time subscriber
[04:10] count, and the total number of views
[04:12] you've gotten in the last 48 hours. That
[04:14] is on the overview page. Let's click on
[04:16] content. On this page, we can also see
[04:18] the total views here, but instead of
[04:20] watch time, it shows us the total
[04:22] impressions we got. And you can click on
[04:24] that and see how many you got on any
[04:26] particular day. You can see the
[04:28] click-through rate here, which is very
[04:29] important. uh and the average view
[04:31] duration of all of your videos combined.
[04:34] You can also break this down by videos,
[04:36] shorts, okay, or live streams or posts,
[04:41] okay? All show you slightly different
[04:43] information. You can click on the all to
[04:46] see even more information. New viewers,
[04:48] regular viewers, subscribers, and so on.
[04:51] There's so much data available to you.
[04:53] I'm going to show you which ones are the
[04:55] most important to to look at. Now, let's
[04:56] get into the individual videos. And this
[04:58] is where I want to talk about what you
[05:00] should be looking at. So to get to the
[05:02] stats of an individual video, there's a
[05:04] couple different ways. Anytime you see a
[05:06] video listed, if you hover over them,
[05:08] you'll see this analytics icon. Okay, so
[05:10] let's click on it for this one here.
[05:12] That'll take you right to that video,
[05:14] the analytics tab for that video. Let me
[05:16] just back up for a second. The other way
[05:18] is you just go to your content tab here.
[05:20] You click on that and it lists all your
[05:23] videos. And if you hover over each one
[05:26] again, you'll see this right here, this
[05:29] analytics tab. We'll click on that.
[05:31] That'll take you to the video. For each
[05:33] video, this is what you should be paying
[05:35] attention to. Total number of views.
[05:37] Okay, that's that's the most important
[05:38] thing. How many views are you getting?
[05:40] Watch time. Another very important
[05:41] thing. You can click on that and see
[05:43] that here. Uh the number of subscribers
[05:45] you get is interesting. Not super
[05:47] important, but if you want to know where
[05:48] your subscribers are coming from, this
[05:50] is how you find out. Again, for all of
[05:52] the things that we're looking at here,
[05:53] all the stats, you can always click up
[05:55] here and and change your time period.
[05:58] So, in this case, since published is
[06:00] selected, but you can click it and
[06:02] change it. So, if you want to see how it
[06:03] performed in the first 24 hours, click
[06:06] here and it'll give you the update.
[06:07] That's how many subscribers it got, how
[06:09] much watch time, and how many views it
[06:12] got. Let me just switch this back to
[06:14] since published again. And now I want to
[06:16] come down to the bottom here. Just
[06:18] scroll down and to this section here.
[06:21] This is an very important graph. This is
[06:23] your average view duration graph. Okay?
[06:26] So, this will show you exactly when
[06:28] people are leaving your video. For
[06:30] example, if I just put this anywhere,
[06:32] let's put it here. 57% of the people who
[06:35] click to watch this video are still
[06:37] watching 2 minutes and 5 seconds into
[06:39] the video. Okay? Very valuable
[06:41] information. Another piece of valuable
[06:43] information, which they summarize down
[06:44] at the bottom here, 70% of my viewers
[06:46] are still watching at around the 30
[06:48] secondond mark. And that's shown in the
[06:50] graph here by this shaded area, this
[06:52] blue area. Uh, and then there's summary
[06:54] up here. So, average view duration of
[06:56] this video is 3 minutes and 51 seconds.
[06:59] That's lower than my norm, but it's a
[07:01] shorter video. And you can see here the
[07:02] video is 7 minutes and 59 seconds long.
[07:05] You can also see that down here. And
[07:07] something else to look for is any dips
[07:09] in this graph. So, I can kind of see one
[07:12] here. It's it's subtle, but it's there.
[07:15] So, I suspect I said something around
[07:17] here that caused people to leave. Okay.
[07:20] So, if I hover over there, I can see the
[07:23] time was 4 minutes and 55 seconds in.
[07:25] So, what I should do is if if I want to
[07:28] learn from this is go back to that
[07:31] video, play it and go to that timestamp
[07:34] 4 minutes 55 seconds in, maybe back it
[07:37] up 5 or 10 seconds and play it and see
[07:39] what I was talking about. see what was
[07:41] going on in the video and try to figure
[07:43] out well say to myself, "Okay, people
[07:46] left in this section of the video and
[07:48] then try to understand why." Okay,
[07:50] that's how you learn. Something else to
[07:52] look for is if you ever see a spike on
[07:54] these graphs that indicates that people
[07:57] went back to rewatch something several
[08:00] times. So, you may see something like
[08:01] that happen. For example, if you put a a
[08:04] graph or some numbers, some stats up on
[08:07] the screen, but they're not on the
[08:08] screen for long enough. people may have
[08:10] to pause and go back and rewatch that
[08:13] section of the video. Or if you said
[08:15] something really funny that they want to
[08:16] or or showed something really funny that
[08:18] people want to see again, they may go
[08:20] back and watch that again. So, views,
[08:22] watch time, average view duration, all
[08:24] super important to beginners. One more
[08:26] that I want to show you. Let's come up
[08:28] here and we can go to reach. It'll show
[08:30] you how many impressions you got. I
[08:32] don't tend to pay any attention to that,
[08:33] but this one, the click-through rate or
[08:36] CTR. So, let's click on that and we can
[08:38] see what our CTR is for this video. So,
[08:42] 4.8% is overall. Again, it's since
[08:46] published. And what that means is 4.8%
[08:49] of the time that an impression is shown
[08:52] either on an end screen or uh on the
[08:55] YouTube homepage, right? Whenever an
[08:58] impression of my of my video or my
[09:00] thumbnail and title is shown to
[09:02] somebody, I get an impression. 4.8% 8%
[09:05] of the time people are clicking on it to
[09:08] watch. Now, that's an average. So, you
[09:10] can see that there was a spike in the
[09:12] beginning. That happens quite often,
[09:14] especially if you have a number of
[09:15] subscribers because your subscribers are
[09:18] the most interested. And if they've set
[09:19] themselves up to be notified when you
[09:21] come out with a new video, they may be
[09:22] very interested in seeing your video.
[09:24] They'll click on it when they see it.
[09:25] So, that's partly why it's usually
[09:27] higher in the beginning because it's a
[09:28] new video. People are excited to see it.
[09:30] In this video, my CTR was 7% in the
[09:33] first day. Second day it was down to
[09:35] 3.9% and then so you can kind of follow
[09:38] it along. One thing I'll point out about
[09:39] CTR. A lot of people ask me what is a
[09:41] good CTR? A good CTR is one that's
[09:46] better than what you normally get. Okay?
[09:48] So you kind of have to look at your own
[09:50] videos to see to see where you normally
[09:53] are and try to improve. And the way you
[09:56] improve your CTR is by making better
[09:58] thumbnails and better titles that people
[10:01] want to click. But just know that that's
[10:02] not that's only one small piece of the
[10:04] entire uh pie here because there's no
[10:08] point in having a good thumbnail and a
[10:10] good title if people get to your video
[10:11] and then don't watch it. And that's
[10:13] where average view duration comes in.
[10:16] And again, that is back here in the
[10:17] overview tab. Scroll down. Average view
[10:21] duration is here. So again, you want to
[10:23] compare your average view duration to
[10:26] your average average view duration or
[10:29] you know you you'll start to get used to
[10:31] what it looks like for your typical
[10:32] videos. Now usually the typical
[10:34] retention is shown on this graph. For
[10:37] this video it's not for some reason.
[10:39] Let's go take a look at another video.
[10:41] Let's go to this one. Analytics. We'll
[10:43] scroll down. Here we go. So in this
[10:45] video we can see a a gray area. That's
[10:48] the average. A typical video would would
[10:51] be in that gray area. For this video,
[10:54] 250 into the video, 47% are still
[10:56] watching. Um, but you can you can kind
[10:59] of hover over this and see that this
[11:00] video kind of rode on the inside of that
[11:03] gray area the whole way along. Something
[11:05] else I want to show you for each
[11:06] individual vid video, when you have
[11:09] views selected, you will see the number
[11:11] of views that you got on each individual
[11:13] or what your total was for each day. But
[11:16] you'll also see that shaded gray area
[11:18] down. In this case, it's down below
[11:20] because this was a really
[11:21] well-performing video. So in this case,
[11:24] in the first 20 days, it had 25,000
[11:26] views. But typically, in the first 20
[11:29] days, my videos would have anywhere
[11:30] between 4.5,000 to 9.6,000
[11:34] views. So that's a good indication that
[11:36] this was a good video, right? My views
[11:38] were much higher than normal. Watch
[11:40] time. If I click there, also much higher
[11:42] than normal. number of subscribers. It
[11:44] doesn't show you normally what you get,
[11:46] but you can see how how the number of
[11:48] subscribers I gained over time for this
[11:51] video. Uh, and then of course the
[11:52] estimated revenue. There are a ton of
[11:54] stats in here or analytics that I don't
[11:57] really ever look at. Okay, I have some
[11:59] favorites though and I want to share
[12:00] those with you. My number one favorite
[12:02] is views per hour, okay, of my most
[12:05] recent videos. And the way I can find
[12:07] that is go to your analytics tab for the
[12:10] entire channel. And then over on the
[12:12] right under real time, you can scroll to
[12:14] the bottom and see the see more button.
[12:16] Click on that. That'll show you how many
[12:17] views you're getting per hour of your
[12:20] top performing videos at any given time.
[12:22] So in this case, uh we can see that this
[12:25] video here is getting 87 views an hour.
[12:28] And you can see a graph over the last 60
[12:30] minutes as to when the views are coming
[12:32] in. I find this super uh helpful to take
[12:35] a look at, but I caution you, [laughter]
[12:38] you can get into a habit of looking at
[12:40] this page and kind of getting mesmerized
[12:42] by it and kind of watching it uh advance
[12:45] in real time. That's a huge waste of
[12:47] time. [laughter]
[12:48] Uh there's no reasonable reason to do
[12:50] that. Um, I happen to like stats and
[12:54] numbers and I don't mind seeing this.
[12:55] But I will tell you that if I leave this
[12:58] screen on for too long, I'll just kind
[13:00] of stare at it and I won't be as
[13:02] productive as I should be otherwise. So,
[13:04] know that this is here. It's a fantastic
[13:06] thing to look at every once in a while.
[13:08] Just don't get obsessed with it. But
[13:10] again, you can see how many views per
[13:12] hour your videos are getting. So, if you
[13:13] want to check this every once in a while
[13:15] to see which videos are performing the
[13:16] best, it'll tell you what the date was
[13:19] of the video. Um, and you can sort by
[13:21] the last 48 hours or by the last 60
[13:23] minutes just by clicking. So, click last
[13:26] 48 hours. Uh, and it sorts that way. If
[13:29] I click here, it'll sort by last 60
[13:31] minutes. Now, if you want more
[13:32] information on any of these videos, you
[13:34] can hover over a video like this. And
[13:37] then you can click to go to its
[13:39] analytics if you want. Okay? Or view the
[13:41] video on YouTube. Okay? That's if you
[13:43] hover over it first. But if you don't
[13:46] hover over it first and you just click
[13:48] it, that'll take you to a similar graph
[13:50] just for that video. Okay, last 60
[13:52] minutes, last 48 hours, and you can
[13:55] hover over these to see how many views
[13:57] they got in any one of the hours. You
[13:59] can see how how deep of a dive this
[14:02] could be and how lost you can get in all
[14:05] these analytics. There's a lot of stuff
[14:07] here that that really isn't going to
[14:09] help you grow your channel. Ultimately,
[14:11] the way to grow your channel is to stop
[14:12] looking at this, go make another video.
[14:15] My next favorite stat, and I've already
[14:17] talked about this a little bit, is how I
[14:19] compare my videos to my channel. Quite
[14:22] simply, I'll go into content, and you
[14:25] know, I can look at my most recent
[14:26] video, go to the analytics for that
[14:28] video. This one was just two days ago,
[14:31] and I look at this graph. So, it's got
[14:34] 3,600 views in the first two days and 26
[14:36] minutes. Uh, but typically, I get
[14:38] 4.2,000 2,000 to 6.3,000 views. So, this
[14:43] video is underperforming. Does that mean
[14:44] it's a it's not a good video or it's a
[14:47] worse video than my typical videos? Not
[14:49] necessarily. There's other factors at
[14:51] play here. For instance, I posted this
[14:54] video on a Saturday. I know from uh
[14:58] doing this for the last couple years
[15:00] that when I post on the weekend, my
[15:02] videos don't tend to do as well. and
[15:04] I've done it enough that I feel like I
[15:07] have enough data to be able to make that
[15:09] conclusion. If you only ever do that
[15:11] once, then the data you posted may not
[15:14] be the reason it's not doing well. It
[15:16] might be the content. It's just not
[15:18] something people want to watch. Okay?
[15:20] So, you have to be careful of that. You
[15:22] can't make uh rash decisions based on
[15:25] like one data point. You have to kind of
[15:27] gather this stuff up over time. But I've
[15:29] come to know that if I post on a
[15:31] Saturday or a Sunday, my videos don't
[15:33] tend to do as well. Um, so I kind of
[15:35] expected this. But that's okay because
[15:37] in the grand scheme of things, like over
[15:40] the lifetime of this video, how it does
[15:42] in the first day or two doesn't matter
[15:45] that much. It's more about ratios,
[15:47] right? like it probably doesn't do as
[15:49] well because, and this is the way I
[15:51] think about it, my my typical viewers or
[15:54] subscribers maybe don't watch videos as
[15:57] much on the weekends or they don't watch
[15:58] my videos as much on the weekends. Okay?
[16:01] But over the lifetime of a video, with
[16:03] any luck, uh, and hopefully I'll gain
[16:06] more viewers to see that video and maybe
[16:08] they will watch it at other times. Okay?
[16:11] And also my subscribers and and typical
[16:14] viewers may become aware of this video
[16:17] once Monday or Tuesday rolls around and
[16:19] they see that I put a video out on the
[16:20] weekend. So try not to get too wrapped
[16:22] up in the day that you post a video. Uh
[16:25] that said, it's good to be consistent
[16:27] and try to do it as consistently as you
[16:29] can. My next favorite stat is traffic
[16:31] sources. We're going to click on the
[16:32] analytics tab. Then we're going to click
[16:34] on content. And if we scroll down, we
[16:37] will see how viewers find your videos.
[16:40] Okay, this is super helpful. So, browse
[16:43] features 51%. Uh, suggested videos 14%,
[16:48] YouTube search, external sources,
[16:50] channel pages, and others. Okay, super
[16:53] useful. Now, if I want to drill down on
[16:55] external, I can click on this tab and we
[16:57] can see that all of the 6.7% of my
[17:01] external traffic, 74% of that 6.7%
[17:06] comes from Google search. All right,
[17:08] Google owns YouTube. So that almost
[17:10] makes sense that that a lot of the
[17:12] traffic comes through Google as well.
[17:13] You ever do a Google search and you see
[17:15] that at the top some video options
[17:18] appear? Those they're pulling those
[17:20] directly from YouTube. And my other
[17:22] favorite stat, if I scroll up here and
[17:24] go to audience and I'll scroll down and
[17:27] I like seeing uh what percentage of my
[17:29] viewers are new viewers, casual viewers
[17:32] or regular viewers. Some common beginner
[17:34] mistakes to avoid. Stop refreshing your
[17:36] data and obsessing over it all the time.
[17:39] >> [laughter]
[17:40] >> I sometimes fall into this trap and I
[17:42] was worse before. I'm a little bit
[17:44] better now. But basically, a watch pot
[17:46] never boils. Okay? So, you're not doing
[17:48] yourself any favors by just staring at
[17:50] your stats. Go make another video.
[17:52] Comparing your channel size to others,
[17:54] that is not helpful. Every channel grows
[17:56] at a different pace. Same thing about
[17:58] subscriber count and watch hour count. I
[18:01] know those are important to get
[18:02] monetized. You do need 1,000 subscribers
[18:05] and 4,000 watch hours in your last 365
[18:08] days to get monetized, but obsessing
[18:11] over those is really not going to help.
[18:13] What helps is making more content and
[18:16] just trying to make your content better
[18:18] each time you make a new video. Don't
[18:20] make drastic changes after 24 hours.
[18:23] Okay? A lot of people I hear from are
[18:25] looking at their stats and they're
[18:26] looking how their latest video is doing.
[18:28] And let's say it's is riding below the
[18:30] average line. Um and and so they feel
[18:33] like, "Oh, I must have done something
[18:35] wrong. Bad thumbnail, bad title. Um I
[18:38] need to change it." Try to avoid doing
[18:39] that. Um you're you're really not, you
[18:41] know, YouTube is testing your video from
[18:44] the moment you uh post it uh onwards,
[18:48] right? And as soon as you make changes
[18:50] like that, you could interrupt that
[18:52] whole thing. I would just let YouTube do
[18:55] its thing with that video. Once you post
[18:57] a video, no matter how it's doing,
[18:59] consider it posted. Your time is always
[19:02] going to be better spent making more
[19:04] content and just trying to get better at
[19:06] making more content. The more content
[19:08] you make, the better you're going to be
[19:10] at making content. Okay? So, and the
[19:13] better your content is, the more people
[19:15] will watch it and the longer they will
[19:17] watch it for. And the longer they watch
[19:19] your content for, the more views you'll
[19:22] get, the more impressions you YouTube
[19:23] will notice that they'll give you more
[19:25] impressions, you know, in your future
[19:26] videos, and everything will start to
[19:29] grow. So, focus on making new content
[19:31] rather than making changes to your
[19:33] already posted content. Here's how to
[19:35] use analytics the right way. Publish
[19:37] your video, then check your analytics 24
[19:39] to 48 hours later. I don't always do
[19:41] that. I often will look at it before
[19:43] that, but I'm not doing myself any
[19:45] favors by doing that. Ask yourself
[19:47] simple questions. Are people clicking on
[19:49] my thumbnail? So, CTR is where you go to
[19:52] find that. And are people watching my
[19:54] video? Are they sticking around? Average
[19:56] view duration is where you go to find
[19:58] that. And when you're looking at your
[19:59] analytics, try to try to find one thing
[20:02] that you can do better. Like if you can
[20:04] if you can see something that's not
[20:05] going well, try to identify something in
[20:08] your video that you can do better and
[20:09] just try to make one improvement on your
[20:11] next video. One improvement per video
[20:13] and the baby steps will add up. I want
[20:15] to show you some hidden but very useful
[20:17] stats that I haven't mentioned yet, but
[20:19] I found these recently and they're
[20:21] pretty cool. What you're going to do is
[20:23] go to your analytics tab, then click
[20:25] down here to see more. So, this is going
[20:27] to give us a summary, okay, a summary
[20:29] views by content, and it's going to list
[20:31] all of my videos. The time period is
[20:33] shown over here. So, this is for the
[20:35] last 28 days, which we can change if we
[20:37] want. And on this page, it gives us a
[20:39] breakdown of the total views that we've
[20:41] gotten in the last 28 days. And it shows
[20:43] us where those views came from, okay?
[20:45] Which video uh is responsible for the
[20:48] views, views, watch hours, subscribers,
[20:51] and so on. And right now we can see this
[20:53] this uh uh chart is sorted by views. We
[20:56] can see that by this arrow here. And if
[20:58] we click something else like watchtime,
[21:00] we can sort by watch hours instead.
[21:02] Okay? Or sort by number of subscribers.
[21:05] So for instance, I can tell that in the
[21:07] last 28 days, this video was responsible
[21:10] for most of my new subscribers. But what
[21:12] I want to show you actually is up here.
[21:14] This is I I just found this recently.
[21:16] And if you click on this, it lists some
[21:18] popular uh stats that you can see. So,
[21:22] top content in the last 28 days, that's
[21:24] what we just looked at. Traffic sources
[21:26] in the last 28 days. You can quickly and
[21:29] very quickly and easily get to that
[21:30] information. Top geographies in the last
[21:32] 28 days. It'll list all the countries.
[21:35] But this one here, first 24 hours video
[21:37] performance. And check this out. So, it
[21:40] lists, let's let's go down here first.
[21:42] Top performing videos, top five. Okay?
[21:46] And then the bottom performing videos.
[21:47] And it shows us the views, which I've
[21:49] sorted on here right now. The
[21:51] impressions uh impression
[21:53] click-through rate. So, CTR, average
[21:55] view duration, and average percent
[21:57] viewed, but they're also shown up top
[22:00] here. So, top performing videos 1 2 3 4
[22:02] 5. You can notice as I hover over them,
[22:05] they get highlighted in the uh chart
[22:07] above. And then we can highlight up
[22:09] here, and it'll show us. So, this is a
[22:11] real handy way to very quickly at a
[22:14] glance look and see which of your videos
[22:16] did the best in their first 24 hours.
[22:20] Something else I want to show you. If I
[22:21] click here and go back to the top
[22:23] content, we can change the metrics that
[22:25] we see. So, it's showing us views, watch
[22:27] time subscribers revenue impressions
[22:30] and so on. We can hide some of these.
[22:31] Hide a metric. So, let's say uh revenue.
[22:35] Let's let's hide that metric. That
[22:37] column is now gone. But we can add other
[22:39] ones, too. So you can click here under
[22:42] metrics and there are so so many look if
[22:45] I scroll down and all of these dropdowns
[22:48] list other ones. Okay. And what I think
[22:51] is super neat is if you go down here to
[22:54] end screens right at the bottom. Click
[22:56] on that end screen element clicks. So
[22:58] we'll click on that. Click apply. End
[23:01] screen element clicks is added and
[23:04] sorted by that. And I can see now that
[23:06] on my end screens, these videos are
[23:09] popping up when my end screen's clicked.
[23:12] If we go back in here, let's go all the
[23:14] way to the bottom again. Endcreen
[23:15] elements shown and clicks per end screen
[23:18] element shown. Let's highlight both of
[23:20] those and click apply. And they all get
[23:23] added right here. And you can see the
[23:24] the CTR, right? The click-through rate
[23:27] of those endcreen elements. Super
[23:29] useful. But uh again, don't obsess over
[23:31] this. So like have a look around and and
[23:32] and you can see some things, but don't
[23:34] get too lost in this. A couple final
[23:36] words. You may get discouraged when you
[23:38] get into your analytics and see that,
[23:40] you know, there's not much in there.
[23:42] You're not getting many views. Your job
[23:44] in the early days is not to optimize
[23:46] everything. It's to learn. Okay? Your
[23:49] job in the early days is to learn. It's
[23:52] to make videos, whether they're regular
[23:54] videos or shorts or or whatever you're
[23:57] trying to do. Make videos, upload them,
[24:01] make more videos. The act of doing that
[24:03] is what is going to improve you as a
[24:06] content creator. The numbers will
[24:09] follow. The stats will grow over time
[24:12] and with volume. The more you create and
[24:15] put on your channel, you're building a
[24:17] base. You're building a library that in
[24:20] the future as as people come in and
[24:22] become subscribers or viewers of your
[24:24] content, uh they will see a growing
[24:27] library. Like imagine a year from now if
[24:29] you post a video a week for a year
[24:31] that's 50 videos. After you make video
[24:33] 50 videos, you're going to be so much
[24:36] better at making videos. So that your
[24:39] 50th is probably going to have a higher
[24:41] average view duration. Your thumbnails
[24:44] will probably be better. So you're
[24:45] probably going to have a higher
[24:46] click-through rate, right? And
[24:48] therefore, YouTube will notice all this
[24:50] and they're going to push your video
[24:52] more. You're going to get more views.
[24:53] You're going to get more watch hours.
[24:54] Okay? And not only that, as you get more
[24:56] subscribers, they will see this library
[24:59] of 50 videos and growing and they'll go
[25:02] back and they'll start watching some of
[25:04] your back catalog and you'll start
[25:05] getting comments like, "Oh, I wanted to
[25:07] see where like I wanted to see how you
[25:09] started, like how good of a creator you
[25:12] were when you started, how good were
[25:14] your videos back then versus now." Or,
[25:16] "I'm just interested in seeing how you
[25:18] evolved and I'm going to binge all of
[25:19] your videos." Right? You'll get
[25:21] subscribers like that. So with volume
[25:23] and with time, your numbers will
[25:26] increase. They they have to. That's
[25:27] that's what happens. That's the way it
[25:28] happens. So try not to get discouraged
[25:30] if your numbers aren't uh where you
[25:33] think they should be. Stop comparing
[25:35] yourself to other channels because that
[25:38] doesn't even matter. Um just focus on
[25:40] your own thing. I hope you found this
[25:42] helpful. My name is Rob. If you're new
[25:43] here, welcome. And if you want more
[25:44] content like this, just let me know in
[25:46] the comments below. And uh maybe that'll
[25:48] be my next video. All right. Thanks.
[25:50] Talk soon. Bye.
⚡ Saved you 0h 25m reading this? Transcribe any YouTube video for free — no signup needed.