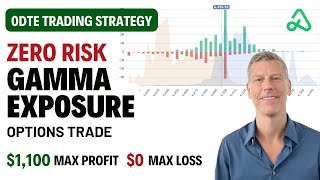

Zero Risk Trade? Iron Butterfly Explained
44sThe promise of a zero-risk trade with guaranteed profit grabs attention and sparks curiosity about how it's possible.
▶ Play Clip"Title accurately describes the trade: a zero-risk 0DTE iron butterfly using gamma exposure."
The video explains how to identify and execute a zero-risk 0DTE iron butterfly trade using gamma exposure analysis. The trader focuses on days when absolute gamma is concentrated at a single strike, indicating a high probability of price pinning. He demonstrates the trade setup, entry, and management, emphasizing the importance of gamma exposure charts.
The trader enters an iron butterfly position with zero risk and a nickel of profit, using gamma exposure charts to identify the trade.
The chart shows gamma exposure concentrated at the 6500 strike, evenly balanced between calls and puts, indicating a pinning point.
Most gamma is associated with the 6500 strike, which is unusual and signals a high probability of price pinning near that level.
Gamma exposure reveals where market makers must hedge. When gamma is concentrated at one strike, market makers' hedging creates a pinning effect.
The trader opens a short put spread when price falls to 64.95, then a short call spread when price bounces to 6496, creating an iron butterfly with a $5.05 credit.
The trader plans to hold the trade, targeting $500 profit from the $1,000 credit, with a maximum loss of only $10.
The trader shows his bots: one up 9.93% after a rocky period, and an opening range breakout bot performing well. He also mentions being flagged as a pattern day trader.
The trader successfully identifies a zero-risk 0DTE iron butterfly trade by focusing on gamma exposure concentration at a single strike. This strategy relies on market makers' hedging behavior to pin the price, allowing for low-risk profits.
What is gamma exposure?
Gamma exposure shows where market makers have to hedge; it is a derivative of delta.
02:17
What indicates a high probability of price pinning?
When absolute gamma is concentrated at one strike and call/put gamma is balanced.
01:11
How does the trader create a zero-risk iron butterfly?
By opening a short put spread and a short call spread at the same strike, receiving a credit greater than the width of the spreads.
04:24
What is the maximum loss on the iron butterfly trade described?
The maximum loss is about $10 (a nickel of profit actually, but effectively zero risk).
05:39
Why did the trader close a Wi-Fi trade for a $110 loss?
To avoid risking the $865 max loss on that trade, as he was entering the gamma exposure trade.
07:00
Gamma Exposure Concentration
Key insight: when gamma is concentrated at one strike, price tends to pin there.
00:30Market Maker Hedging
Explains the mechanism behind gamma pinning: market makers adjust hedges, creating price action.
02:17Zero-Risk Trade Setup
Demonstrates a practical application of gamma exposure to create a risk-free trade.
03:55[00:02] trade I made just a few moments ago where I got into this. It's an iron butterfly position with zero risk. It actually has a nickel of profit associated with it. In this video, I'm going to be going over the logic I used
[00:17] in order to find and make this trade, which is this gamma exposure chart right here. Um the theory behind gamma exposure, how it works, and how I've been using it in my own personal trading. First thing I just want to say
[00:30] is I've been waiting for a day like today in order to make this video. If you look here at this chart I'm looking at, this chart is giving us a visual of the gamma exposure call verse put side. And if you look, most of the gamma
[00:43] exposure right now is at this one strike, the 6500 strike. And it's pretty evenly balanced. That is exactly what I'm looking for. So if we look at the default chart here, the net gamma, you can see it looks like there's this flip
[00:57] point here where this is the important level. But what I've been discovering in my own trading is the most important part of this gamma exposure trading is finding these points where the gamma exposure is on one particular strike. So
[01:11] is the absolute gamma chart. And if you look it, it's pretty obvious most of the gamma is associated with this 6,500 strike right now. And that might seem, you know, like it makes a lot of sense considering the price is near 6,500. But
[01:26] the truth is usually this is not the case. And it's also very common that it's not balanced in the way that it is. So as soon as I find a day like today where the absolute gamma is all associated with one strike and the call
[01:39] and put gamma is highest at that one particular strike as well. This is a day where there's a good chance that the price is going to pin somewhere around this 6,500 strike. Now, it doesn't mean it's going to pin at that price all the
[01:53] way until the end of the market close. There's just a good chance that it's going to pin somewhere around that price during the day today. And that may change towards the end of the day as the market makers start repositioning
[02:05] themselves for wherever the gamma exposure is for tomorrow. So, if you exposure, here's a quick little overview. Basically, these various
[02:17] different levels that we're looking at are giving us insights into where market makers are going to have to make hedges. And if gamma is a derivative of the delta value, so market makers in general are trying to keep their portfolios
[02:31] delta neutral. And whenever the price of the stock hits a certain level to where uh there's enough gamma exposure that the delta value is going to start changing rapidly, we can predict that at those levels, market makers are going to
[02:46] have to adjust their hedges and that will dictate certain price action. In this particular case, when we see this one pillar with a lot of positive and chance that there's going to be a balanced action of selling short and
[03:00] buying long. And this is going to create a a point where the price is going to get pinned at this one particular level. So if we look at tomorrow's chart though, you can see there is a bit of action here at the 6500 strike, but
[03:13] there's also it's, you know, a lot of action at other strikes. It's not quite so defined. So there's a good chance though because there the biggest action is at the 6500 strike. Again, we could pin at 65 all the way until the end of
[03:29] the day today. Some days though it doesn't work that way. So some days it'll have this big price for today and then tomorrow there'll be another and then tomorrow there'll be another price at a different level where uh the
[03:42] most of the gamut exposure is. And if that's the case, this pin price won't hold all the way until the end of the day because towards the end of the day, gravitating towards wherever the pin price is for the following day. So, if
[03:55] we take a quick look at exactly how I ended up getting into these two trades, you can see here what happened is the price fell to 64.95 this morning. And when the price fell down to 64.95,
[04:09] um I and again, I'm looking for it to pin up there around 6,500. I went ahead and opened an in the money, completely in the money short put spread for a credit of $2.60. And then when the price ultimately
[04:24] bounced back up around 6,500, you can see here it was actually at 6496. So it wasn't quite there yet. I went ahead and opened up this short call spread at the 6,500 strike as well,
[04:39] spread at the 6,500 strike as well, creating a iron butterfly in which it had a $5 width, but I got a $5 and a nickel credit, making it impossible for trade. So, I'm going to be holding this trade until later on the day, looking to
[04:55] take down a sizable portion of these two credits that I received that tally up to around $1,000. Actually, it looks like right now I can potentially close these two positions and take down $130 of profit already, and I've only been in
[05:10] I'm going to let them go throughout the day, assuming it's going to stay day, assuming it's going to stay somewhere around this 6,500 strike. And uh I'll be able to take in a larger percentage of that $1,000 credit later
[05:24] on in the day. I'm going to be targeting somewhere around $500. So if you look at this particular position, the worst I can do is make about 10 bucks. And the best that I can do is take down a sizable portion of that $1,000 credit,
[05:39] which is what I'm going to be going after since I don't have any risk. So, you what it is that I'm looking for every day. I'm looking for one of the days where this there's a tremendous amount of gamut exposure at one
[05:53] particular strike. And the gamut exposure is well balanced, meaning and on the call side. So, if we look here, there's 6,500 contracts of open interest on the call side, 4,100
[06:08] contracts of open interest on the put side. Also, a lot of action. This chart that you're seeing, this is today's volume. There's a lot of volume currently at that strike as well on the call side. The put side also has a
[06:22] decent amount of volume. It looks like 19 almost 20,000 contracts have been traded as well on the put side. So, there's a lot of action at this 6500 strike, and I'm hoping that indicates that it's going to pin there. So, let me
[06:35] go ahead and jump on over here and show you some of my bots. If you've been following along in this video series, I started with $10,000. I do want to share with you guys, I did get flagged as a pattern day trader. I closed an iron
[06:47] condor position or actually was an iron butterfly, one of wies right here, and got instantly flagged as a day trader. So, I did have to bring my account balance up to $25,000. that has enabled me to make a few day
[07:00] trades, which has been good and bad. I'll share with you today, this morning, I actually closed the Wi-Fi trade um and took a $110 loss on it. I did that because I was making this gamma exposure trade instead and I saw that 6,500 bar
[07:16] and if you look the end at the max loss for this iron butterfly was the 6,500. So, I decided to close it when I could for only $110 loss instead of risking the $865. So, I did make a couple other ones here.
[07:32] If you look, these were closed on the day they were opened and I took down a small little profit instead of risking. I think one of these turned out to be a max loss and the other one would have turned out to be a pretty decent profit.
[07:45] Um, but either way, I closed them in advance. You can see there was this rocky period we had last week early in the week for sure where it took a couple the week for sure where it took a couple losses as well um after what was a nice
[07:57] run for a while. So this bot is still doing good though. If you look it's up doing good though. If you look it's up $9,93% it. It had a little runup in the beginning. It did go sideways or down
[08:11] for a long period of time I'm showing you here and then it's been on an uptick ever since then. So, this bot is available in the option alpha community also paper trade it. I'll show you where in just a moment. Uh, the other bot
[08:25] that's been on a tear lately is this opening range breakout. And I'll include a link to another video where I shared this particular strategy and the back But if you look, it's been doing pretty well. Um, it's been doing really well
[08:39] community. Thank you, God, for blessing us with this bot. Um, if you look here, alpha community that members have shared with each other. It's a beautiful thing that we have going on here. Everyone contributing their work back um, and
[08:54] able to use the work of others. This opening range breakout bot is currently doing really well for people. Um, you can see here the Wi-Fi bot that I just was looking at as well. This one was doing better last week. It had a bit of
[09:07] a rocky period, so it's fallen down, but overall, I've had success with it, and I know that there's a lot of other people who are having success. Feel really everyone who's a part of it. Thank you everyone who's contributing your work.
[09:20] So, that's it for today's video. Thanks for watching and I'll see you again next time. [Music]
⚡ Saved you 0h 09m reading this? Transcribe any YouTube video for free — no signup needed.