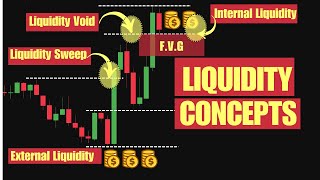

Why Price Hits Your Stop Loss
45sOpens with a relatable trader frustration, hooking viewers with the promise of revealing smart money secrets.
▶ Play Clip"Title accurately promises eight liquidity concepts and delivers them with clear explanations and examples."
This video explains eight liquidity concepts used by smart money to trap retail traders, including buyside and sellside liquidity, sweeps, runs, internal and external liquidity, liquidity pools, and liquidity voids. It teaches how to identify these patterns and trade alongside market makers.
Smart money uses liquidity to trigger stop-losses and take retail traders' positions before moving the market in the intended direction.
Buyside liquidity forms above key highs where retail traders place buy stop orders and short sellers' stop-losses. Smart money pushes price above to trigger these orders, then sells into the buying pressure and reverses the market.
Sellside liquidity forms below key lows from breakout sellers and long traders' stop-losses. Smart money pushes price below to sweep these orders, buys at a discount, and reverses price upward.
A liquidity sweep grabs stops and reverses, offering clear entries. A liquidity run grabs stops but continues in the trend direction, making it harder to trade.
Steps: identify key liquidity zones, watch for the sweep, wait for confirmation (close below the swept high), enter short, place stop above the high, target next support with 2:1 risk-reward.
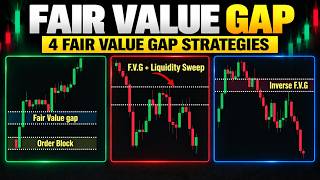
External liquidity is at swing highs/lows (price extremes). Internal liquidity is within fair value gaps. Price rotates between them: from external to internal and back.
Liquidity pools are areas where pending orders cluster, built by retail traders at obvious levels. Smart money hunts these pools by building a trap, creating inducement, sweeping the pool, then reversing or running.
A liquidity void is a sharp, one-sided move with no resistance, often a gap. Price usually returns to fill the void, offering entries at premium/discount zones aligned with order blocks.
Understanding liquidity concepts helps traders identify smart money traps and trade with the institutional flow, improving entry timing and risk management.
What is buyside liquidity?
Buyside liquidity is a cluster of buy orders above key highs, including breakout buyers' stop orders and short sellers' stop-losses, which smart money targets to sell into.
00:40
What is sellside liquidity?
Sellside liquidity is a cluster of sell orders below key lows, including breakout sellers' stop orders and long traders' stop-losses, which smart money targets to buy into.
01:47
What is the difference between a liquidity sweep and a liquidity run?
A liquidity sweep grabs stops and reverses direction, while a liquidity run grabs stops but continues in the trend direction.
02:40
What is external liquidity?
External liquidity refers to price extremes (swing highs and lows) where many stop orders are placed.
05:35
What is internal liquidity?
Internal liquidity refers to fair value gaps within the body of a price move, where price seeks balance.
05:35
What is a liquidity pool?
A liquidity pool is an area on the chart where pending orders are waiting to be triggered, typically above highs or below lows, built by retail traders.
08:46
What is a liquidity void?
A liquidity void is a sudden sharp move in price with little resistance, often a gap, that usually gets filled later.
12:54
What are the four steps smart money uses to exploit liquidity pools?
Build the trap, create inducement, sweep the pool, then reverse or run.
10:11
What is the recommended risk-to-reward ratio for trading liquidity sweeps?
2:1 or higher.
05:08
Where should you place a stop-loss when trading a buyside liquidity sweep?
Just above the high that was swept.
04:56
Buyside Liquidity Defined
Core concept explaining how smart money uses retail buy orders above highs to sell into and reverse the market.
00:40Sweep vs. Run Distinction
Key differentiation that helps traders choose the safer setup (sweep) over the aggressive one (run).
02:40External vs. Internal Liquidity
Explains the rotational pattern of price between extremes and fair value gaps, a foundational ICT concept.
05:35Liquidity Pools Are Retail Traps
Highlights that liquidity pools are created by retail emotions, not smart money, and are hunted for entries.
08:46Liquidity Void as Imbalance
Describes a one-sided move that often gets filled, providing high-probability entry zones.
12:54[00:00] Ever wonder why price always seems to hit your stop loss right before going exactly where you expected? That's not an accident, it's liquidity, and smart money is using it to take your trade before taking the market.
[00:12] In this video, you'll learn 8 powerful liquidity concepts. Buy side liquidity, sell side liquidity, liquidity sweep, liquidity run, internal liquidity,
[00:24] external liquidity, liquidity pool, and liquidity void. Before we dive in, make sure to like the video, subscribe to the channel and hit the notification bell so you never miss out on smart money strategies that can level up your trading.
[00:37] Let's get started. We'll begin with one of the most important concepts, buy side liquidity. Buy side liquidity is where smart money looks to sell at premium prices, often trapping retail traders in the process.
[00:49] Here's the idea. When price approaches a previous high, like yesterday's high, weekly high or equal highs, Many retail traders place their buy stop orders just above it. Why? Because they expect a breakout.
[01:01] At the same time, traders who went short earlier also place buy stop losses above those highs, just in case price goes against them. So now you've got two types of buy orders stacked above the high, breakout buyers and
[01:13] short sellers stop losses. Smart Money sees this liquidity cluster and says, perfect, they push price above the high, trigger all those buy orders, fill their own massive sell orders and reverse the market.
[01:25] a buy-side liquidity hunt. They use your orders as fuel and then leave you behind. In this chart, price forms equal highs. This is a typical area of buy-side liquidity. The market moves slightly above the highs. Stop-loss orders are triggered. Then price reverses in the opposite direction.
[01:42] The breakout was not genuine. It was a liquidity trap used by smart money. Now flip the script. Sell-side liquidity is where smart money looks to buy, usually below key lows. Just like before, we've got two types of sell orders below the low. Breakdown sellers, trying to catch the new
[01:56] downtrend, and buyer stop losses. Both create a pool of sell orders, just below a support level, like a daily low, equal lows, or the bottom of a trading range. Smart money pushes price below
[02:08] that level, sweeps the liquidity, fills their buy orders, and drives price back up. It's the same game, just reversed. Watch this example. Price breaks below a recent low. Sell stop orders are triggered, then price quickly reverses to the upside. This was a sell-side liquidity
[02:24] sweep. It was designed to trap early sellers and provide smart money with better entry prices. Now that you understand buy-side and sell-side liquidity, let's go deeper. Smart money uses two powerful tactics to target those zones, the liquidity sweep and the liquidity
[02:39] run. If you learn to spot them, you can follow in the footsteps of market makers and trade with them, not against them. So what is a liquidity sweep? A liquidity sweep is when price grabs stop losses and then reverses.
[02:52] The whole move is meant to trap retail traders and give smart money a better price. In a downtrend, it usually means sweeping sell-side liquidity below previous lows, then reversing upward. In an uptrend, it means sweeping buy-side liquidity above previous highs, then dropping back down.
[03:07] The goal? Take liquidity first, then reverse. What is a liquidity run? A liquidity run is different. Here price targets liquidity but keeps going in the direction of the trend. So in a bullish trend, price might break above a high, grab the liquidity and continue rising.
[03:24] In a bearish trend, price breaks below a low and keeps falling. No reversal, no clean entry, just momentum. So which one should you trade? Both are useful, but for most traders, liquidity sweeps are easier and safer to trade.
[03:38] Why? Because they offer clear entry points, strong risk-to-reward setups, and they show you exactly where smart money is entering. Liquidity runs? They're fast, aggressive, and often hard to catch
[03:50] unless you already in the trade Let break down how to trade a liquidity sweep at the highs during an uptrend using the same steps smart money traders follow The first thing you need to do is identify key liquidity zones In an uptrend focus
[04:04] on obvious highs, previous swing highs, equal highs or round number levels. These are hot spots where retail traders place stop losses or breakout buys, making them rich with buy side liquidity. Next watch for the sweep. Price pushes above a
[04:19] a previous high and triggers those buy orders. Retail traders think it's a breakout, but smart money is using this moment to sell into the buying pressure and fill their short positions. Then wait for confirmation. Don't jump in right after the sweep. Instead, watch the candles. You
[04:34] want to see price close back below the high that was taken out. That's your signal the sweep is likely complete and smart money is shifting direction. Now it's time to enter the trade. Once you've seen that confirmation close, you can look to go short. You're now aligned with
[04:48] the smart money, entering just after they've executed their own positions. Place your stop just above the high that was swept. This keeps your risk tight while giving the trade room to breathe if the reversal continues. Finally, set your target. Look for the next support level,
[05:03] structure low, or zone where price is likely to react. Stick with a 2 to 1 risk to reward ratio or higher to ensure long-term profitability, even if you take losses along the way. We've used an uptrend example here, but the exact same principles apply in a downtrend,
[05:22] just in reverse. Instead of looking above the highs, focus on liquidity resting below the lows. You've probably heard traders say, price moves from liquidity to liquidity. But did you know not all liquidity is created equal?
[05:34] There are two main types smart money hunts, external liquidity and internal liquidity. Understanding the difference can help you spot the big traps and avoid entering at the wrong time. To understand this better, let's picture a rally leg in the market, a clear movement
[05:47] from a low to a high. The highs and lows that form during this movement are what we refer to as external liquidity. These are the price extremes where many stop orders are placed. Now, in contrast, the fair value gaps that appear between that high and low, within the
[06:02] body of the move, are what we call internal liquidity. Price is constantly transitioning between these two types, internal and external. You can think of it like a continuous loop. Price either moves from external liquidity to internal, or from internal liquidity back
[06:16] to external. In simple terms, price goes from a swing high or low to a fair value gap, or from a fair value gap to a high or low. That's the core pattern that drives market movements. Now, if we refer to this schematic, we can see an upward rally that begins by sweeping
[06:31] the external liquidity above the previous high. Once that liquidity is taken, price pulls back toward internal liquidity, aiming to fill the fair value gap that was left behind. From there the market makes another push back toward external liquidity, targeting the next
[06:45] high and sweeping those stops. With external liquidity cleared, price returns once again to seek balance, moving back down to internal liquidity zones, where it fills more recent fair value gaps.
[06:57] And once that gap is filled, the market often turns its attention back toward the next external liquidity point. Alright, let's jump into a real chart to see how all of this plays out in live price action. We're looking at the Euro-US dollar on the 5 minute timeframe and I want you to focus
[07:11] closely on this upward move here because it's not a full trend continuation, it's just a pullback inside a larger structure. Now watch what price does. First, we can see that price dips just below a previous low.
[07:24] This move sweeps the external liquidity sitting underneath that level. These are the stop losses placed by traders who went long earlier and smart money loves to target these before making a move. After that liquidity grab, price quickly retraces
[07:37] upward, but it doesn't just go anywhere. It heads directly into a fair value gap, which is our internal liquidity zone. This upward retracement is part of a classic rebalancing phase where the market looks to fill in inefficiencies left behind by aggressive moves Once that internal liquidity is filled notice how clean that touches Price reverses again this time dropping lower to target external liquidity below the next major low
[08:00] And just like before, as soon as that external liquidity is swept, what happens? Price transitions once again, this time re-entering internal structure, moving right back into another fair value gap. And from that internal liquidity zone, we get yet another reversal.
[08:16] This sequence shows you exactly how price rotates, from external liquidity to internal liquidity and then back again. It's like a heartbeat. Grab, rebalance, grab and rebalance. Pro tip, anytime you spot price violating a swing high or low,
[08:31] don't rush to chase the move. Ask yourself, is this a liquidity sweep? And where's the next fair value gap? That question alone can keep you one step ahead of retail traders. Let's talk about ICT liquidity pools.
[08:44] one of the most important pieces of the smart money puzzle. A liquidity pool is not some magical zone. It's simply an area on the chart where a high concentration of pending orders is waiting to be triggered. Now here's the key.
[08:56] These pools are where smart money looks to enter or exit, not where retail traders win, but where retail traders get taken out. So where do liquidity pools form? There are two classic locations. Above obvious highs, where breakout traders place buy-stop orders.
[09:10] This creates buy-side liquidity, below obvious lows, where stop losses from long trades and breakout sell stops cluster together. That's your sell-side liquidity. But here's what most traders miss.
[09:22] These pools aren't created by smart money. They're built by retail traders making emotional decisions at obvious spots. Stop losses place just below swing lows or above swing highs. Breakout buys and sells right at key levels.
[09:35] Trades driven by fear of missing out or panic exits. Smart money doesn't chase these levels, they hunt them. To them, liquidity pools aren't danger zones, they're entry points.
[09:47] They wait for retail orders to stack up like dominoes, then strike, price spikes into the pool, triggers all the stops, then reverses, leaving retail trapped and confused. There are other specific areas in the market where liquidity pools form just as reliably.
[10:01] Double tops and double bottoms, triple tops and triple bottoms, and trend lines. These are zones where traders set stop losses or expect breakouts. Smart money uses these expectations against them.
[10:14] Here's how smart money uses liquidity pools. The first step is what we call build the trap. Smart money lets price form clean highs or lows, obvious levels that screen breakout to retail traders. It's all part of the setup.
[10:27] Next comes create the inducement. They tease a breakout. Price nudges past those levels just enough to get emotional traders to jump in, thinking they're catching the big move. Then, sweep the pool. Now the real game begins.
[10:40] Price dives into the liquidity zone, triggering stop losses and filling smart money's larger orders at premium prices. Finally, reverse or run. This is the moment of truth. Either price snaps back sharply, a classic liquidity sweep, or blasts forward with momentum,
[10:54] a full liquidity run. Now let's see the smart money playbook in action on a real chart. The market moves sideways. You notice price respecting a clear range, bouncing between the same highs and lows.
[11:06] Some traders see this and think, this is solid resistance, if price breaks out, I'm buying. Others are already shorting from the top of the range, with stop losses just above the highs. As price keeps rejecting the same levels, liquidity begins to pull, just above that resistance.
[11:20] Buy stops, stop losses, pending orders, all stacking up. Smart money is watching and waiting. This is the road. Now the bait, price climbs aggressively back toward the top of the range.
[11:34] You start seeing bullish candles with strong closes near the highs. Retail traders react instantly. There it is. The breakout is happening They jump in with buy orders Short sellers panic and exit their trades Momentum builds FOMO kicks in Smart money has everything they need A predictable reaction from the crowd
[11:53] Then it happens. Price spikes just above the range, triggering all those buy stops and stop losses. For a moment, it looks like a breakout, but it's not. That was the liquidity sweep. Smart money just used that spike to fill their large sell orders. By taking the other side of
[12:08] every retail buy. They've absorbed the liquidity. Now it's time to make their move. Suddenly, price snaps back down into the range. The breakout was fake. Buyers are trapped. Smart money is now in full control. The reversal is sharp and unforgiving. This isn't a pullback, it's a flush. A clean sweep
[12:25] that reverses the entire move. Retail traders are left stunned. Why did price breakout then crash right back down? Because the breakout wasn't real. It was engineered. A setup to trigger retail orders
[12:37] and feed smart money's positions. The real move begins after the liquidity is taken. That's where the smart money profits, and retail panic sets in. Now let's wrap things up with the final concept,
[12:49] liquidity void. A liquidity void is a sudden, sharp move in price where price jumps or drops quickly without much resistance in between. Think of it like a gap in the market. On the chart, it looks like price moves
[13:01] from one level to another, leaving a large, empty space behind. That empty space? That's the liquidity void. An area where there wasn't enough buying or selling interest to slow price down. Now, here's the key. Liquidity voids almost always get filled.
[13:16] When we say filled, we mean that price often returns back to the origin of the move, to rebalance that imbalance. Liquidity voids usually offer two possible entry zones. The middle of the void, where price first paused or hesitated.
[13:29] The premium or discount zone, depending on the direction. But here's the trick, you don't just enter anywhere. The valid entry is the one that lines up with a strong point of interest, like an order block or supply and demand zone.
[13:41] If the point of interest is in a premium zone after a strong move up, it often aligns with a supply zone, making it a valid area to look for shorts. If the point of interest is in a discount zone after a sharp drop, it usually aligns
[13:54] with a demand zone, making it ideal for long setups. Let me show you an example. As you can see here, the market was trending upwards. Then, suddenly, price dropped aggressively with almost no pause. That sharp, clean drop is what we call a liquidity void.
[14:09] Now, you might ask, why is this called a liquidity void and not just a displacement? Here's the difference. A displacement often involves resistance where buyers and sellers are still fighting.
[14:21] But this move? It's one-sided. There's no resistance at all, no signs of hesitation. it's a pure smart money move. That's why we call it a liquidity void, because price slices through the levels like there's no one on the other side, just clean imbalance and momentum. Now, look left,
[14:39] you'll notice this void broke the previous market structure. That confirms the creation of a supply zone at the origin of the drop. Once we've identified the liquidity void, the next question is, when do we enter? Simple, we wait for price to retrace back to fill the imbalance. And the
[14:54] best area to look for entries, right at the supply zone, which now acts as a premium level. Watch what happens next.
[15:09] Price climbs back up, slowly filling the void, and when it finally taps into that premium supply zone, it gets rejected hard, and price drops again. Clean setup, clear logic, classic smart money behavior.
[15:22] And that wraps up our full breakdown of liquidity concepts, from sweeps to voids and everything in between. If this video helped you understand the market better, give it a like and subscribe so you don't miss the next strategy.
[15:34] And if you've got questions or a favorite concept from today, drop it in the comments, I'd love to hear your thoughts. Thanks for watching and I'll see you in the next video.
⚡ Saved you 0h 15m reading this? Transcribe any YouTube video for free — no signup needed.