
Why Stochastic Beats RSI
60sDirect comparison between two popular indicators sparks debate and interest among traders.
▶ Play Clip"Delivers multiple actionable strategies as promised, though some repetition and filler reduce the score."
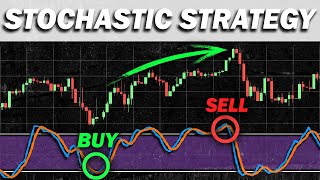
This video presents several stochastic indicator strategies for day trading forex and stocks, emphasizing the importance of combining the stochastic with trend-following indicators like the 200 EMA and MACD to avoid trading against the trend. The presenter explains why they prefer stochastic over RSI and provides detailed entry, exit, and risk management rules.
The stochastic is a popular indicator used as a momentum indicator and to predict reversals by identifying overbought and oversold levels.
Stochastic moves between overbought and oversold levels cleaner and smoother than RSI, and the K and D lines provide additional signals for direction.
Beginners often buy when stochastic is oversold and sell when overbought, but this fails in strong trends because the indicator can stay at extremes for long periods.
If price is above 200 EMA and stochastic is oversold, take a buy; if price is below 200 EMA and stochastic is overbought, take a sell. Wait for stochastic to cross back inside the lines for confirmation.
For buy positions, place stop loss below nearest swing low and profit target at 2x stop loss. For sell positions, place stop loss above nearest swing high and profit target at 2x stop loss.
Combine stochastic with trend lines and support/resistance. When price touches a trend line and stochastic is oversold, wait for cross back inside to buy; similarly for resistance and overbought.
If price is above 200 EMA, stochastic oversold, and MACD line crosses above signal line, take a buy. For sells, price below 200 EMA, stochastic overbought, and MACD crosses below signal line.
The video provides multiple high win-rate stochastic strategies that emphasize trend alignment and confirmation to avoid common pitfalls. The key is to combine the stochastic with trend indicators and wait for confirmation before entering trades.
What are the two main uses of the stochastic indicator?
As a momentum indicator and to predict reversals by identifying overbought and oversold levels.
00:18
Why does the presenter prefer stochastic over RSI?
Stochastic moves between overbought and oversold levels cleaner and smoother, and the K and D lines provide additional signals.
00:33
What is the common beginner mistake when using stochastic?
Buying when oversold and selling when overbought without considering the trend, which fails in strong trends.
01:53
In the stochastic + 200 EMA strategy, when do you take a buy position?
When price is above the 200 EMA and the stochastic is oversold, after waiting for it to cross back inside the oversold lines.
02:51
What is the exit strategy for buy positions?
Place stop loss below the nearest swing low and set profit target at two times the stop loss.
03:43
What additional confirmation is needed in the stochastic + MACD + 200 EMA strategy?
The MACD line must cross above the signal line for buys, or below for sells.
07:02
Stochastic vs RSI
Explains a key advantage of stochastic over RSI, which is valuable for traders choosing indicators.
00:33Trend Filter with 200 EMA
Introduces a simple yet effective way to avoid trading against the trend, a common pitfall.
02:51Confirmation Rule
Emphasizes waiting for the stochastic to cross back inside the lines, reducing false signals.
03:29Support/Resistance Combination
Shows how to combine stochastic with trend lines for higher probability setups.
05:20[00:03] with the stochastics indicator so without further ado let's get on with the video the stochastics is one of the most famous and the reason that most traders use it is because the indicator can be utilized
[00:18] in various ways it can be used as a momentum indicator and it can also be used to predict reversals by identifying overbought and oversold levels on the market now as you may know a similar indicator that
[00:33] levels is the rsi and so what makes the stochastics better than the rsi firstly if you compare the two you can
[00:45] actually see that the sarcastics tend to move between overbought and oversold levels a lot cleaner compared to the rsi which this secondly the movement of the stochastics
[00:59] is a lot smoother compared to the rsi which is much more erratic another lines called the k percentage and the d percentage which
[01:12] can actually give us additional signals here's how so when you're using the rsi there is no way of predicting if the line is going to go upwards or downwards but if you're using the stochastics
[01:27] you can actually utilize the k and d lines to predict where the stochastics if the k line crosses below the d line it indicates that the sarcastics is heading downwards and if the k line crosses above the d
[01:40] indicates that the sarcastics is heading upwards so those are a couple of reasons on why i prefer stochastics over rsi okay so how do we actually use the stochastics
[01:53] beginners make when trading this indicator position when the indicator hits oversold position when the indicator hits overbought
[02:06] strategy is because if the market is on a strong the stochastics can actually remain at overbought or oversold levels for long periods of time for example here we can see that the
[02:21] market is on a strong uptrend if you decided to take a sell position overbought let's see what happens the price instead and you will lose your money because remember trading against a trend
[02:37] is never a good idea so instead of using the stochastics by itself i like to complement this strategy by adding another indicator that can detect the medium-term trend and that is the 200 ema
[02:51] strategy knowing that i'm always following the trend and how the strategy works is very simple if the price is above the 200 ema while the saw classics is that oversold
[03:05] you take a buy position and it's the same for sale positions as and it's the same for sale positions as well if the price is below the 200 ema while the sarcastics is at overbought you take a sell position
[03:17] but keep in mind you cannot immediately take a position just because the stochastics is that overbought or oversold actually confirm that the reversal will happen
[03:29] by waiting for it to cross back inside the overbought or oversold lines like this now let's discuss our exit strategy so if you're taking buy positions you want to place your stop loss below the
[03:43] and set your profit target at two times your stop loss and if you're taking sell positions you want to place your stop loss above the and set your profit target at two times your stop loss
[03:57] so now let's look at this strategy in action in this chart we can see that the price is above the 200 ema is above the 200 ema meaning we only take buy signals next
[04:09] the oversold levels but remember don't take any positions yet you need to wait for it to cross back inside the oversold lines first once this happens you take a buy position next
[04:23] you place your stop loss below the nearest swing low your stop loss and as you can see the price hits our profit target so this counts as a successful trade
[04:37] let's look at another example in this chart we can see that the price is below the 200 ema meaning we only take cell signals then the overbought levels next you wait for the indicator to cross
[04:53] back inside the overbought lines once this happens you take a sell position now for stop loss you place it above the nearest swing high and set your profit target
[05:05] at two times your stop loss and as you can see this trade ended up being profitable now a similar strategy that traders is by combining the stochastics with simple support resistance and trend
[05:20] lines so now let's analyze the chart here uptrend and so we can draw a trend line here multiple times next we can actually see a pattern
[05:34] towards the trend line while the stochastics is that oversold it tends to reverse times already prices hit and reverse hit and reverse
[05:49] so now as we look at the current price we can see the same pattern forming prices went down to the trend line while the stochastics is at oversold but remember you need to wait for the stochastics to cross outside of the
[06:04] oversold lines first once this happens you take a buy once this happens you take a buy position we can see that price has rejected this level multiple times
[06:18] here next we spotted a similar pattern every time prices went up to resistance while the stochastics is that overbought it tends to reverse downwards and now as we look at the current price
[06:34] we can see the same pattern forming again prices went up towards the while the sarcastics is that overbought next i'm waiting for the sarcastics to cross outside of the overbought lines
[06:47] position [Music] often utilize is by combining the stochastics with the is by combining the stochastics with the macd indicator and the 200 ema this is
[07:02] how the strategy works if the price is above the 200 ema while the sarcastics is that oversold and the macd line crosses above the signal line you take a buy position it's the same
[07:16] for cell positions as well if the price is below the 200 ema while the stochastics is at overbought and the macd line crosses below the signal line you take a sell position now for your
[07:29] exit strategy if you're taking buy positions you want nearest swing low and set your profit target at two times your stop loss and if you're taking cell positions you
[07:42] want to place your stop loss above the swing high your stop loss let's look at this strategy in action in 200 ema
[07:56] while the stochastics is that oversold meaning we are looking to buy however we won't be taking positions before we see a confirmation from the macd once this happens you take a buy
[08:09] now for your stop loss you place it below the nearest swing low your stop loss and as you can see this trade ended up being profitable
[08:23] chart we can see that the price is below the while the stochastics is at overbought meaning we're looking to sell next we can see that the macd line crosses below the signal line
[08:38] position and for your stop loss you place it above the nearest swing high and set your profit target at two times your stop loss and as you can see this trade ended up
[08:52] [Music] so i just revealed to you multiple high win rate stochastic strategies that you can use right now and all i ask for in return is for you
[09:04] liking the video and subscribe two clicks but it means so much to me and you can also check out my other videos as well so thank you guys for watching and i'll
[09:17] so thank you guys for watching and i'll see you in the next video
⚡ Saved you 0h 09m reading this? Transcribe any YouTube video for free — no signup needed.



