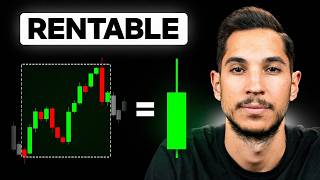

Trading Strategy for Full-Time Job Holders
43sDirectly addresses a common pain point of balancing trading with a job, promising a solution with just 30 minutes a day.
▶ Play Clip"The title promises a strategy for working traders, and the video delivers a concrete four-step plan, though it emphasizes that hard work is still required."
This video presents a four-step trading strategy optimized for individuals who work full-time jobs and have limited time to trade. The strategy focuses on trend reversals using daily and 4-hour timeframes, requiring only 30 minutes to an hour per day for execution, though significant backtesting and journaling are still necessary for profitability.
Many people struggle to become profitable traders because they don't adapt their strategy to their routine and personality, especially when balancing a job.
Only two timeframes are used (daily and 4-hour). Daily dedication is 30 minutes to 1 hour, but this does not exclude backtesting and journaling. The strategy focuses on trending markets, avoiding range-bound markets.
Use tools like diagonal support/resistance lines or moving averages to spot a trend reversal. The example shows a downtrend breaking resistance, confirmed by a 50-period exponential moving average.
After the initial impulsive move, wait for a pullback that reaches the 0.50 Fibonacci retracement level. The price must react at this level; if it goes too far beyond 0.618 or doesn't reach 0.50, discard the trade.
Wait for the price to break below the 0.50 level on the 4-hour chart, then close above it. Enter a market position at that close.
Set stop loss at the 0.75 Fibonacci level and take profit at the 1.272 Fibonacci extension level. For long-term trades, use the 50-period moving average on the daily chart; for medium-term, on the 4-hour chart.
Demonstrates the strategy on a stock in a downtrend. The same steps apply: identify reversal, wait for pullback to 0.50, execute on 4-hour chart, set stop loss and take profit.
This strategy is not a get-rich-quick scheme; it requires hard work to master but is optimized for those with limited daily time. The key is to focus on trending markets and strictly follow the four steps.
What are the two timeframes used in this trading strategy?
Daily timeframe and 4-hour timeframe.
02:04
What type of markets does this strategy focus on?
Trending markets, avoiding range-bound markets.
02:41
What is the first step of the strategy?
Identify a trend reversal using tools like diagonal support/resistance lines or moving averages.
03:09
What Fibonacci level is used to confirm the pullback?
The 0.50 Fibonacci retracement level.
06:34
When should a trade be discarded?
If the price does not reach the 0.50 level or goes beyond the 0.618 level.
07:47
What is the entry signal on the 4-hour chart?
Price breaks below the 0.50 level and then closes above it.
09:55
Where is the stop loss placed?
At the 0.75 Fibonacci level.
11:15
Where is the take profit placed?
At the 1.272 Fibonacci extension level.
11:15
What tool is used to set the take profit level?
Fibonacci extension tool.
11:30
How can long-term trades be managed?
Using the 50-period moving average on the daily chart.
12:16
Challenge of Trading with a Job
Identifies the core problem the strategy solves: balancing trading with full-time employment.
00:01Two Timeframe Approach
Simplifies analysis by using only daily and 4-hour charts, reducing time commitment.
02:04Fibonacci 0.50 as Key Level
The 0.50 retracement is the critical confirmation level for trade entry.
06:34Execution on 4-Hour Chart
Provides a clear, rule-based entry signal that can be checked once daily.
09:27Stop Loss and Take Profit Placement
Defines specific Fibonacci levels for risk management, making the strategy systematic.
10:47[00:01] pursue it professionally or to generate extra income, but you're finding it too difficult to learn and trade because you have a job that takes up too much of your trading while also having a side job is even harder than learning
[00:17] to trade without that job. And I'm not suggesting you quit your job for this; I uploaded a video a few months ago explaining what you need to consider when leaving your job to focus solely
[00:31] main problems many people face is that they don't become profitable traders because they aren't using the right strategy. And by that, I don't mean that the strategy they're using or have been taught isn't profitable;
[00:44] I simply mean that they haven't adapted that strategy to their routine and personality. But that's over now, because in this video, I'm going to reveal the best trading strategy for trading while working another
[00:58] job. This strategy consists of just four steps and requires only 30 minutes to an hour a day, allowing you to avoid having to... Sacrificing sleep to trade means not having to give up
[01:11] plans with family and friends, and maintaining the emotional and financial stability of a side job, since you won't have to quit that job under any circumstances. But be careful, I
[01:25] 'm not saying this is the typical methodology sold online where you dedicate half an hour a day, generate thousands of dollars, and don't have to dedicate much time. On the contrary, you'll have to work hard to
[01:37] become profitable with this strategy. This is simply a profitable trading strategy like any other, but optimized so it doesn't take up too much time
[01:50] daily and can be combined with other
[02:04] specific steps that make up this trading strategy, I want to explain three general aspects you need to know. If you don't, you won't be able to properly understand the strategy we'll discuss
[02:16] next. The first is that we'll only use two timeframes: the daily timeframe and the 4-hour timeframe. I'll explain the function of each later. The second aspect is that you'll dedicate
[02:28] half an hour or an hour a day to trading. The watchlist, but then you're going to have to work, you're going to have to do backtesting, review your trades, keep a trading journal. In other words, this half hour, this hour, doesn't exempt you from
[02:41] all the incredible work you have to do behind the scenes, trading strategy. The third aspect trending markets, leaving aside any market that's range-bound. So
[02:56] you can choose which asset you want to trade: forex, currencies, commodities, stocks, whatever you want. You'll just have to choose the market that's performing best. So, having discussed these three general aspects, let's move on to
[03:09] the four steps of the a trend reversal, that is, an asset that's moving in one
[03:22] direction turning around and starting to move in the opposite direction. For this, we can use multiple tools. We can use diagonal support and resistance lines, or we can even use moving averages to make it all more
[03:37] visual. For example, look at this case where we have an asset that's forming a downward movement, and there's a specific moment that allows us to specific moment that allows us to mark two zones: a support zone and
[03:50] resistance zone. Understanding that the moment that resistance is broken, a trend reversal will begin, which is precisely what has happened here. Now, look at what happens if we add a 50-session exponential moving average.
[04:04] The same structure becomes even clearer. The moving average isn't mandatory; it's simply an extra tool that can be added to make the chart analysis even more visual. What we need to
[04:17] focus on is the analysis and study of price action, as this is what will indicate when that trend reversal has begun. The second step is to wait for the price to form a pull,
[04:30] following the daily chart and waiting for it to reach levels that confirm a complete trend reversal. You might say, "Hey Alex, hasn't a trend reversal already formed?" The answer is no. Look, I'm going to explain it very
[04:43] quickly by explaining how the market moves. How does the price move? The price moves in three directions: uptrend, downtrend, or range. This is simply a very quick and visual example
[04:56] of the three directions, but as we know, the trend... An uptrend moves this way, a downtrend moves this way, and a range moves this way. If we look a little closer and better define what we're seeing,
[05:11] the uptrend and the downtrend have one characteristic: in an uptrend, the lows and highs are rising; in a downtrend, the lows and highs are falling. Therefore, what
[05:27] confirms an uptrend or a downtrend is the succession of rising highs and lows, or falling highs and lows. So now we not only differentiate between these two trends, but we also
[05:40] come here and determine why this is a range. It's a range because it has neither rising highs and lows nor falling highs and lows. So, in order to determine and confirm a trend change to a
[05:55] specific direction, what we have to wait for is that the price not only stops forming that the price not only stops forming a downtrend, not only forms a rising high, but also forms a pullback to
[06:07] confirm a low. So in this case, we already have that confirmation of a trend reversal, and that's precisely what we need to focus on in the asset we're currently analyzing. So, what's the level that
[06:21] interests us to confirm the trend reversal and for the price to start making higher highs and higher lows? Well, for this specific strategy, and for many others, the level is the
[06:34] 0.5 Fibonacci retracement. When we'll later establish certain rules to execute the trade. So, when we see that impulsive movement begin to
[06:48] slow down and initiate a downward movement, as is precisely the case we're seeing, what we're going to do is mark Fibonacci levels. So, we're going to go to the chart, to the top left where our
[07:02] face appears. If the drawing panel is covered, we'll activate it and keep an eye on the third emoticon, since that's where Fibonacci retracement. I recommend that you add both the retracement and the extension
[07:18] to your favorites, as we'll use them later. Now, what we're going to do is... Clicking on Fibonacci retracement hides the side panel, and as I mentioned, when the price starts to
[07:32] pull back, we'll apply Fibonacci from the low to the high of the impulse. Now, we have the Fibonacci correction levels clearly defined, and in this case, we'll mark the 0.50 level in green. This is
[07:47] precisely where we want to see a significant price reaction. The price can reach the 0.618 level, which is good, but if it goes too far beyond that level, or if it does n't even reach the
[08:03] n't even reach the 0.50 level, we'll discard that trade completely. For those interested in learning more about Fibonacci trading, understanding this tool better, the retracement, the extension, how to use it in different
[08:15] strategies, and how to configure it correctly, below in the first video description, you'll find a free, nearly hour-long Fibonacci trading course where I explain everything you need to know about this incredible
[08:28] tool. Now that you know the setup we're looking for, it's time to talk about execution. Which I will determine in the next but what I would like you to do
[08:42] are enjoying the video, and the Subscribe button if you are not already subscribed. Please also leave a comment saying not only what you think of this video but also which market you believe is most profitable in this
[08:56] trading strategy. I will review the comments, and there is a market where, due to its characteristics, this will be watching to see if you are correct or not. Also, below in the
[09:12] description of this video, you will not only find the free Fibonacci trading course other links of interest containing profitable trading strategies, guides, tutorials, and training— all 100% free content so you can continue
[09:27] learning as a trader without needing to invest your own money. We are now in Step Three: the execution phase. The execution will be very intuitive and simple, as this is a very practical strategy, and as I said, it is...
[09:41] Optimized to require the least amount of time possible, as it's important to balance it with other activities like work, hobbies, or whatever. So, all I'm going to do is wait 4 hours for the price to
[09:55] break or fall below the 0.50 Fibonacci level, recover that level, and form its first close above it. Right now,
[10:09] as you can see on the screen, we're already at the 0.50 level on the daily chart. Now, all we have to do is go to the 4-hour chart, and as you can see, the price has already fallen below the 0.50 Fibonacci level. All we have to do
[10:21] fallen below the 0.50 Fibonacci level. All we have to do and form a close above that 0.50 level, something that
[10:33] happens quite quickly in this specific example, as it's literally the next candlestick. The moment this happens, we'll execute our market position, only needing to set a
[10:47] stop-loss and a take-profit order. Finally, in step four, we'll discuss stop loss, take profit, and position management. As you can see, we've executed our market trade at the
[11:00] on the screen. Now, we'll go directly to the daily chart, as everything will be clearer there. We'll execute the position right here, placing a stop loss at the
[11:15] 0.75 level to allow for price movement and a take profit at the take profit at the 1.272 Fibonacci extension level. We'll click on the Fibonacci extension tool and set the range
[11:30] from the beginning of the impulse to the end of the impulse and to the end of the pullback. This will give us different levels, and we'll be different levels, and we'll be focusing on them.
[12:01] of their own interests and how they want to manage their trades—whether more or less aggressively. Regarding long, short, or medium-term trading, those who want to take a long-term approach should
[12:16] manage their trades using the 50-period moving average. For those looking to trade in the medium term, the 50-period exponential moving average (50-period moving average) with a 4-hour timeframe is ideal, while for those looking to trade in the short term, the
[12:30] those looking to trade in the short term, the better than the other; one may simply suit your trading style better than the other. Having used a long example with
[12:43] a cryptocurrency, I'll now use a short example with a stock to demonstrate its effectiveness across short example with a stock to demonstrate its effectiveness across mentioned earlier, it performs slightly better in one market. I'll read your
[12:56] comments below. Let's look at the chart and observe upward trend. For a trend reversal to occur, it needs to How can we monitor this?
[13:09] Firstly, by using diagonal lines. I've marked this diagonal line, and I know that when the price begins to break through it, or actually breaks through it, a trend reversal may be forming. Alternatively, we can monitor
[13:24] daily. Let's replay this analysis to see how it develops. This movement, and right here we can already see that it's overbought and the first breakouts are starting to form. So when the counter-trend pullback starts to form,
[13:38] we're going to use Fibonacci. That is, right here we're seeing that at this precise moment upward movements are starting to form. We use Fibonacci, we go down, Fibonacci retracement
[13:53] from the high to the low, and we're going to be watching the 0.50 level. This point interests us. Why? Because the level hasn't been touched or rejected. We mentioned before that if the 0.50 level isn't touched, or if the 0.618 level is clearly broken,
[14:10] 0.50 level isn't touched, or if the 0.618 level is clearly broken, case, a clear rejection or token hasn't formed at the 0.50 level, so we're going to keep repeating until that structure forms. The
[14:24] price approaches it again, it hasn't touched it yet. The price seems to be approaching it again. In this case, it practically touches it, but it's too close. We're going to wait longer. And in this case, yes, we 've already touched it. At this very moment,
[14:40] we copy the retracement of... Using Fibonacci, we switch to the 4-hour chart, copy the I mentioned earlier: an upward breakout followed by a
[14:54] downward close to execute the position. We continue moving forward, and at this precise moment, we've already broken upwards. We have to wait for have to wait for a downward close, which is
[15:08] appearing right now. So, we execute the position at market price. We would literally enter here, and as soon as the price closes, we would place the Stop Loss at the 0.75 level. To set the Take Profit,
[15:21] we copy this box and switch to the daily chart, since we're going to use the Fibonacci extension. This would be the entry point. To see the Take Profit point, we go to the extension, click from the beginning of the
[15:38] impulse to the end of the impulse, to the end of the pullback, and we'll place the Take Profit exactly at the 1.272 Fibonacci extension level. Each
[15:51] person, in this case, would manage the position as they see fit. In this case, we see that the initial price The downward trend is currently hindering that movement, but it will eventually reach the
[16:03] 1,272 level. This isn't a random level; it's a very optimistic but very possible level within those Fibonacci extension movements, and it's regardless of their strategy.
[16:18] Remember, this isn't a trading strategy where you can work very little and earn a lot of money. It's simply a trading strategy that, as you've seen,
[16:32] However, to develop and master this strategy and become profitable, you'll need to dedicate many hours, just like with any strategy. But that's in terms of learning, not
[16:45] execution, and not in terms of using the strategy daily. Remember that below, in the first pinned comment and in the description of this video, interest, such as courses, tutorials, training, and other
[16:58] profitable strategies—all 100% free content so you can continue your trader training without investing your own money. Also, I'd like to see in the comments which asset you... Do you think it's optimal for this
[17:10] strategy? It works incredibly well, as I've said, for all assets, since what interests us is the trend, not the asset itself. But there's one specific asset among all those in the world that, due to its characteristics and
[17:24] conditions, is more optimal than the others. So, I want to read your here. I hope you liked it and that it was helpful, which is the important thing. If share it with friends and family, and I'll see you in the next video.
[17:40] see you in the next video. [Music] [Music] Goodbye
⚡ Saved you 0h 17m reading this? Transcribe any YouTube video for free — no signup needed.