
Institutional Footprints: The Secret to Profitable Trading
45sReveals a powerful trading insight that combines supply and demand with smart money concepts, appealing to traders seeking a competitive edge.
▶ Play Clip"Delivers a full course on combining smart money concepts with supply and demand, exactly as promised."
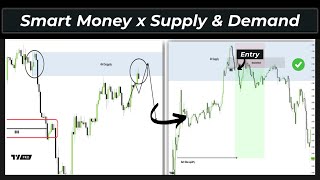
This video presents a complete trading strategy that combines smart money concepts with supply and demand theory, offering three entry models (fair value gap, mitigation block, breaker block) to achieve consistent profitability. The strategy uses a higher timeframe to identify key zones and a lower timeframe for precise entries, with real chart examples on EUR/USD and Bitcoin.
The trading setup combines supply and demand concepts with fair value gap, breaker blocks, and mitigation blocks to create a powerful, rule-based strategy.
In a bullish trend, breaking a high creates an unmitigated demand zone at the origin of the impulse leg. In a bearish trend, breaking a low creates an unmitigated supply zone.
Price reacts to demand zones because institutional money previously entered there. Institutions scale in gradually, so they revisit zones to fill remaining orders.
The process involves: base, expansion (rally/drop), retracement and mitigation, and continuation. Focus on the continuation phase for high-probability entries.
Recommended combinations: 1-hour with 5-minute, or 4-hour with 15-minute. Higher timeframe zones (4H, 1H) are more reliable.
Identify at least two successive bullish breaks of structure, then find the demand zone at the origin of the latest break. Wait for price to return, then confirm with a market structure shift on lower timeframe.
1) Fair value gap within the market structure shift leg. 2) Mitigation block: swing low, swing high, higher low, then displacement closing above swing high. 3) Breaker block: swing low, lower low, then expansion with market structure shift.
On 4H chart, price in downtrend with multiple bearish BOS. Supply zone identified at origin of latest BOS. Price tapped zone, then on 15M chart a breaker block formed, providing short entry with 4:1 risk-reward.
On 4H chart, Bitcoin in bull run with bullish BOS. Demand zone at origin of expansion. Price tapped zone, then on 15M chart a market structure shift and fair value gap formed, providing long entry.
Combining higher timeframe supply/demand zones with lower timeframe confirmation patterns (fair value gap, mitigation block, breaker block) creates a robust, mechanical trading strategy that aligns with institutional order flow.
What defines an unmitigated demand zone in a bullish scenario?
The last down close candle or series of consecutive down close candles at the origin of the bullish impulse that caused a break of structure.
01:59
What are the four key steps in the supply and demand cycle?
Base, expansion (rally/drop), retracement and mitigation, and continuation.
04:03
What timeframe combinations does the strategy recommend?
1-hour with 5-minute, or 4-hour with 15-minute.
04:31
What is a mitigation block in a bullish context?
A swing low, then a swing high, then a higher low, followed by a market displacement leg that closes above the swing high. The up close candle(s) between the first low and first high form the block.
08:02
How does a breaker block differ from a mitigation block?
A breaker block requires a lower low (not a higher low) after the first swing low, then an immediate expansion in the opposite direction.
08:40
What is the first confirmation needed before entering a trade?
A market structure shift or clear change of character on the lower timeframe after price taps the higher timeframe zone.
05:53
Why do institutions revisit supply/demand zones?
Because they scale in gradually and need to execute remaining orders after their initial trades left footprints.
03:35
Institutional Footprints
Explains why supply/demand zones are powerful: they represent where institutional money previously entered.
03:19Focus on Continuation
Emphasizes that the highest probability entries occur during the continuation phase, not the initial move.
04:18Three Entry Models
Provides three distinct, mechanical entry methods (FVG, mitigation block, breaker block) for flexibility.
07:22Bitcoin Bull Run Example
Demonstrates the strategy in a strong trending market, showing how to identify demand zones and enter with a fair value gap.
12:18[00:02] episode of smart risk. Correctly combining supply and demand zones with your trading strategy is one of the most powerful ways to become consistently profitable. These zones represent institutional footprints, giving you
[00:14] stronger confluence and clearer trade direction. That's why in today's video, plan that combines smart money concepts with supply and demand theory into one complete trading model, featuring multiple entry methods to help you catch
[00:28] A+ trades. And I won't just explain the theory. I'll take you step-by-step through how to apply this rule-based strategy directly on your charts using three different entry models, all presented in the simplest and most
[00:41] mechanical way possible. So, make sure to watch until the end. We always appreciate your support, so please give this video a thumbs-up and subscribe to our channel if you are new. See you after intro.
[01:05] This trading setup combines supply and demand concepts with the classic fair value gap model, breaker blocks, and mitigation blocks, creating a powerful be your only setup to become a consistently profitable trader.
[01:20] Before diving into the details of the trading setup, let's have a quick but important recap about supply and demand areas and see how to properly identify them. In a bullish scenario, every time price
[01:33] breaks a high to the upside, it creates an unmitigated demand area tied to the impulse leg. Similarly, in a bearish trend, whenever price breaks a major low to the downside, it forms an unmitigated supply
[01:45] area. So, essentially, supply and demand zones are the areas from which price makes a strong impulsive move that leads to a break of structure. So, to highlight supply and demand zones properly, you need to focus on the very
[01:59] beginning of the impulse move that caused the break of structure. This is the exact spot where the price aggressively pushed away. In a bullish scenario, the last down close candle or a series of consecutive
[02:13] down close candles at the origin of the bullish impulse represents the demand zone. For example, in this case, the last two consecutive down close candles before the expansion form an unmitigated demand
[02:26] zone. Similarly, in a bearish scenario, the last up close candle or a series of consecutive up close candles at the origin of the bearish expansion move represents the supply zone.
[02:41] Now, you might ask, why does price react to a demand zone? And what's the to a demand zone? And what's the psychology behind it? scenario, at some point there just isn't enough demand to keep driving price
[02:54] higher. So, the market naturally pulls back. Once price finds enough supply to consume and begins filling the unfilled demand left behind, it triggers a shift leading to a drop in price and a natural
[03:07] But here's what really makes these zones powerful. They're not just random support areas. They're where institutional money previously stepped in and placed long positions.
[03:19] before institutional orders are executed. That's why they carry so much weight. When price revisits these zones, institutions often step in again to Another key reason is that large institutions rarely enter the market all
[03:35] at once. They scale in gradually, often in multiple stages, especially around zones where their earlier trades left clear footprints. orders were filled during the first move.
[03:48] opportunity to execute the rest of their trades. to revisit these zones. The same logic applies in reverse for supply zones. Now, here's the bigger picture. All of
[04:03] this plays out in four key steps. The base. The expansion. Which could be a rally or a drop. The retracement and mitigation. And finally, the continuation. And here's the part that matters most.
[04:18] We always focus on the continuation phase because that's where the highest probability entries show up. This strategy works with two time frames, a higher time frame to analyze market conditions and identify
[04:31] high-quality supply and demand zones, and a lower time frame to zoom in for entries. My recommended combinations are the 1-hour with the 5-minute or the 4-hour with the 15-minute.
[04:46] Of course, you can use other time frames as well, but the key rule is that your least two levels above your entry time frame. Also, keep in mind that supply and demand zones on the 4-hour and 1-hour
[04:58] charts are far more reliable and price is much more likely to respect them. Now, let's break down the details of this trading setup and see exactly how to execute trades with it. In a bullish scenario, the first step is
[05:12] and that buyers are in control of the market. To do this, you need to identify at least two successive bullish breaks of Once that happens, shift your focus to the most recent bullish break of
[05:26] From there, trace back to the origin of the bullish expansion move, the move that initiated the break. This origin point is what forms the demand area. The next step is to highlight the most
[05:39] higher time frame. Then, wait for price to return to that zone. Once price taps back into it, zoom into a lower time frame, such as the 15-minute or 5-minute chart, and monitor
[05:53] closely for signs of reversal. That will serve as your first confirmation before This could be a market structure shift or a clear change of character. Either way, that serves as your first layer of confirmation.
[06:07] if you want a funded challenge account for just $10, hurry up. Funded Next just launched a limited offer for their $10,000 stellar accounts, dropping the $10,000 stellar accounts, dropping the price from $59 to only $10. But keep in
[06:22] mind, only the first 10,000 traders can claim this deal. So, make sure to register using our exclusive link and apply the coupon code in the description Funded Next also offers accounts from $5,000 to $200,000 and even instant
[06:38] funded accounts with no challenge phases, meaning you can start trading real capital from day one. Check the link in the description and get funded This market structure shift signals that the temporary bearish move is ending and
[06:52] bullish momentum is likely coming back. At this point, the price is expected to time frame. Once the bullish market structure is confirmed and we expect price to move lower, the next step is to look for a
[07:06] At this stage, we have three different entry approaches to open a position. In this case, a buy position. Each method has its own pros and cons. The classic fair value gap model, the mitigation block, and the breaker block.
[07:22] These areas often act like magnets, attracting price to retrace into them before continuing upward. So, in the first entry method, once price taps into the higher time frame supply or demand zone and forms a market
[07:35] structure shift on the lower time frame, we then look for a bullish fair value gap that forms within that market structure shift leg. That's where we frame. For the take profit, you can target the
[07:48] nearest liquidity pool on the current time frame or aim for higher time frame larger move. Similarly, in the second entry approach, after price taps into the higher time frame supply or demand area, if it forms
[08:02] a mitigation block on the lower time frame, that gives us a strong opportunity to go long. For a bullish mitigation block to form, price first needs to create a swing low, then a swing high, followed by a higher
[08:15] low. After that, price should make a market displacement leg that closes above that swing high. In this case, your bullish mitigation block will be the up close candle or
[08:28] series of up close candles formed between the first low and the first high. To execute a long trade, you can place a limit order at the highest point of that mitigation block and wait for price to
[08:40] Note that this is different from a breaker block because with a breaker block, we look for a lower low to be formed, not a higher low. So, in the third entry method, we are looking for a bullish breaker block to
[08:53] form inside the higher time frame supply or demand zone. For a valid breaker block, price needs to first create a swing low, followed by a lower low. After that, we should see an immediate
[09:06] expansion move in the opposite direction that produces a market structure shift. In this scenario, the up close candle or series of up close candles formed between the first swing low and swing high will mark your breaker block area.
[09:21] long position. The exact same concepts apply to bearish entry methods, just in reverse. Now, let's break down this trading setup Now, let's break down this trading setup with a real trade example.
[09:35] Here we have the euro dollar 4-hour chart on the screen. As you can see, price is in a strong downtrend and bears are clearly in control. multiple bearish breaks of structure, more than two for sure.
[09:49] This tells us that the expectation is for the price to continue lower and our focus should be on looking for short opportunities. The most recent bearish BOS is located right here.
[10:01] At the origin of the move that caused this BOS, we can see an unmitigated So, I'm going to highlight these three up-close candles as my supply area. This gives us a fresh supply zone. And this is exactly where we want to keep
[10:15] Because it's an ideal area to look for short opportunities if price pulls back The next step is simply to wait for price to tap into this 4-hour unmitigated supply. Now, let's unfold the chart
[10:29] and see what happens next. As you can see, price pushed higher and tapped directly into the 4-hour supply zone. So, now in place. A strong downtrend with multiple bearish
[10:43] a clear break of structure on the 4-hour chart, and a fresh unmitigated supply zone formed at the extreme, now tapped by Now, everything looks perfect. So, I'm going to zoom into the 15-minute time
[10:57] frame to monitor the price action inside the 4-hour supply zone and identify a suitable entry point to go short. With the 15-minute chart on the screen, you can see that after tapping into the higher time frame supply, the price
[11:11] structure shift. At the same time, it created a breaker block represented by these two down close candles. Notice the sequence here. Price first formed a swing high, then a
[11:25] swing low, followed by a higher high. But immediately after, it reversed direction and closed below those down close candles. block, giving us another strong layer of confluence for a short entry.
[11:39] can anticipate that the price will return to the breaker block zone before continuing its move toward the sell side liquidity. So, here's my plan. I'm setting my entry at the lowest point of the breaker block
[11:52] with my stop loss just a couple of pips above the higher high. For the take profit, I'm targeting the sell side liquidity below this swing low, which gives us roughly a 4:1 risk to reward ratio.
[12:05] Now, let's play out the chart and see how this trade unfolds. As you can see, the order was triggered. After a brief drawdown, price reversed, pushed lower, and eventually hit the take profit, exactly as expected.
[12:18] Now, let's move on to the next real chart trade example. Here we have the Bitcoin dollar 4-hour chart on the screen. As you can see, the overall market profile is strongly bullish.
[12:30] Bitcoin is in the middle of a bull run. Looking closer, you can see that price created a break of structure with this large bullish momentum candle, breaking high. This tells us that buyers, the bulls,
[12:44] are in control of the market. Based on that, we should expect price to continue moving higher. With this confirmation, our focus shifts entirely toward finding buying opportunities.
[12:56] Next, our focus shifts to the origin of this bullish expansion move, the very move that initiated the latest break of structure. This origin point has formed a demand area. Notice that I'm not highlighting these
[13:08] two down close candles here. If you look closely, you'll see that the candle with the wicks of the following green candles. Since I don't consider more than three candles when defining supply and demand
[13:22] zones on the 4-hour chart, I simply mark the zone starting from the lowest point of the expansion move, its true origin. This leaves us with a fresh unmitigated demand zone. And this is exactly where we want to keep our eyes. It's an ideal
[13:36] area to look for long opportunities if price pulls back into it. Now, let's play the chart forward to see what happens. As you can see, price taps into the zone and shows rejection. At this stage, I
[13:48] zoom into the lower time frame, in this case, the 15-minute chart, to closely track price action within the 4-hour demand zone and look for any signs of reversal and refine a suitable entry point for a long
[14:01] trade. Now, here on the 15-minute chart, if you tapping into the 4-hour fresh demand zone, price rejected and formed a market structure shift by breaking and closing above this 15-minute swing high.
[14:15] This tells us that selling momentum is fading, buyers are stepping back in, and 4-hour trend. is confirmed on the 15-minute chart, we
[14:27] higher. The next step is to look for an entry point for a long trade, whether that's a fair value gap, a breaker block, or a mitigation block. If you look closely, you'll notice that
[14:39] price has created a bullish fair value gap inside this market structure shift This area often acts like a magnet, pulling price back before continuing to the upside. So, in this case, I'd set my entry at
[14:52] the highest point of that 15-minute bullish fair value gap using a buy limit triggered. Now, let's see if our trade plays out successfully. As you can see, price pushed lower,
[15:08] then shifted direction, pushing higher exactly as expected. This confirms the effectiveness of combining higher time frame demand zones with lower time frame confirmations for sniper entries.
[15:23] That's it, traders. Thanks for watching. I hope you found this video valuable. If you did, hit subscribe and turn on notifications so you never miss an update. Drop a comment below with your thoughts or topics you'd like to see
[15:35] next. Your support means the world to us. See you in the next video.



⚡ Saved you 0h 15m reading this? Transcribe any YouTube video for free — no signup needed.