
Spotting SMT Divergence on Charts
60sPractical chart example that shows how to identify the pattern, satisfying the audience's desire for actionable knowledge.
▶ Play Clip"Delivers a thorough, practical guide on SMT divergence with real examples, though some repetition and filler reduce the score."
This video provides a detailed tutorial on Smart Money Techniques (SMT) divergence, a key tool for identifying market reversals and selecting strong or weak assets. The presenter explains how to spot SMT divergence by comparing correlated assets like Bitcoin and Ethereum, and demonstrates its application in various markets including cryptocurrencies, forex, stock indices, and metals.
SMT divergence is a key tool in the Smart Money Concepts (SMC) framework. It is used to identify reversals and choose between strong and weak assets, primarily in cryptocurrency markets.
The concept of strong and weak assets is introduced. In a bullish scenario, the stronger asset is preferred for long positions, while in a bearish scenario, the weaker asset is shorted.
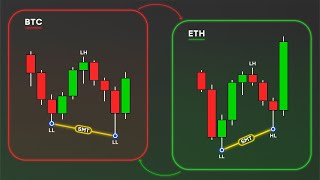
Bitcoin and Ethereum have a strong positive correlation and typically share the same price structure. Healthy pricing is symmetric, with lows and highs aligning.
SMT divergence occurs when two correlated assets show asymmetric pricing. For example, if Ethereum forms a Low while Bitcoin forms a Higher Low, it indicates smart money activity and a potential bullish reversal.
A bullish SMT divergence is a signal for growth, while a bearish divergence (asymmetry at structural highs) indicates active selling and a downward reversal.
Compare spot charts from the same exchange for accuracy. The presenter analyzes spot charts and switches to futures for entry.
On Bitcoin, a Lower Low, Lower High, and another Lower Low form. On Ethereum, a Low and Lower High appear, but then a Higher Low forms, creating a discrepancy. This is a bullish reversal signal for both.
SMT divergence is determined only by swings. A five-swing swing (Lower Low) and a three-swing swing (Higher Low) are used. The central candle is key, and confirmation occurs at the close of the third candle.
Without the final candle, the divergence is not confirmed and should not be used. The appearance and closing of another candle confirms the divergence.
SMT divergence works on all timeframes, but higher timeframes have priority. If there is a conflict between timeframes, the higher timeframe wins.
On both charts, key swings are highlighted. A clear discrepancy appears when Bitcoin forms a maximum range while Ethereum does not, indicating SMT divergence.
Without a full three-swing swing, the divergence is not valid. Often the next candle renews the high, and assets move symmetrically again. Always wait for confirmation.
After defining a three-swing swing on Ethereum and a five-swing swing on Bitcoin, adjust the SMT divergence to the marked swing. This is a strong reversal indicator.
SMT divergence shows increased smart money activity earlier than other instruments. A divergence from above is bearish, indicating distribution and preparation for decline.
When shorting, choose the weak asset (e.g., Bitcoin forming a Higher High) as it will fall faster and deeper. Ethereum shows strength with a High-High.
Instead of waiting for a correction, enter short on the breakout of the key swing. Weak assets often do not correct, so a breakout is the optimal entry.
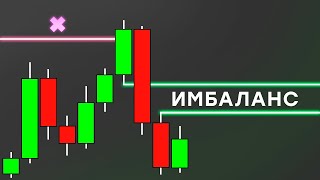
The short position closed with a 1:1 risk-reward ratio, an excellent result. The imbalance was not rebalanced, but the entry was prepared in advance.
SMT divergence is an early reversal indicator and helps choose the right asset. For bearish, focus on weak asset; for bullish, prioritize strong asset.
SMT divergence helps determine if an area of interest will be reached. For example, Bitcoin shows weakness (Lower Low) while Ethereum shows strength (Higher Low), making Ether preferable for longs.
When divergence hints at aggressive growth, don't wait for a correction to your zone. Start looking for entries at current values or use alternative assets.
Bitcoin shows local weakness but global strength. After updating a swing high, roles may change. This divergence indicates a market turn and a normal correction for entry.
Place a stop loss under the second candle of the formation to increase RR. Take profit is conditionally set at RR 1:1, but in real trading, set take profits on the left side of the chart at key liquidity zones.
In the example, Bitcoin's imbalance is partially filled, and the position is successful. Waiting for a deeper decline would have missed the entry.
SMT divergence helps identify reversals, choose assets, understand correction depth, and assess whether zones will be tested.
Compare Bitcoin, Ethereum, and any altcoin. Look for situations where two assets move synchronously and the third deviates, giving a key signal.
Analyze correlation by sectors, e.g., MMA (most popular arcs: spikes, PEP). If one asset shows strength (Higher Low) while others show weakness, prioritize the strong one.
The presenter recommends creating a study list divided into sectors for easier analysis.
For currency pairs, use the dollar index (DXY). It has a negative correlation with EUR, GBP, AUD. If DXY forms a High, the pair forms a Low, and vice versa.
A High-High on DXY while the pair forms a Higher Low is a bearish divergence for DXY and bullish for the pair. This signals dollar distribution and euro strength.
If DXY forms a Lower High while the pair forms a Lower Low, it's a positive SMT divergence for the pair and bearish for the index. DXY weakness leads to EUR, GBP, AUD strength.
An example shows both types of divergence appearing simultaneously, indicating a strong signal for long positions in EUR.
For pairs like USD/JPY, USD/CHF, USD/CAD, the correlation with DXY is positive. A Higher Low on DXY and a Lower Low on the pair is a bullish divergence for the pair.
Bearish SMT divergence works similarly, looking for decorrelation at structural highs. An example shows triple SMT divergence on DXY, a strong bearish signal.
Triple SMT divergence occurs when the pair forms three consecutive highs while DXY forms a High-High, Low-High, and another High-High. The fourth point rarely occurs, making it a strong bearish signal.
Compare S&P 500, Dow Jones, and Nasdaq. They have strong correlation, and one index is always ahead or behind. In the example, Dow Jones lags, showing weakness, making S&P and Nasdaq priorities for longs.
Compare gold and silver. Gold forms a Lower Low then Higher Low, while silver shows Lower Low and another Lower Low. This is a bullish reversal, indicating silver weakness and gold strength. If a key swing is broken, enter long with a conservative stop.
The topic is simplified; deeper analysis of smart capital behavior exists. The presenter offers an advanced video and a PDF summary in Telegram.
SMT divergence is a powerful early reversal indicator that also helps in asset selection and understanding market structure. By comparing correlated assets, traders can identify smart money activity and make more informed trading decisions.
What is SMT divergence?
SMT divergence is an asymmetry in price structure between two correlated assets, indicating smart money activity and a potential reversal.
01:08
What does a bullish SMT divergence indicate?
It indicates smart money is actively entering the market and a bullish reversal is beginning.
01:24
What is the key condition for using SMT divergence?
The divergence must be based on valid swings: a five-swing swing (Lower Low) and a three-swing swing (Higher Low), confirmed at the close of the third candle.
02:41
Which timeframe has priority in SMT divergence?
The higher timeframe always has priority. If there is a conflict, the higher timeframe wins.
03:53
When shorting, which asset should you choose?
Choose the weak asset, as it will fall faster, deeper, and is more likely to reach targets.
06:32
What is the optimal entry for a short on a weak asset?
Enter on the breakout of a key swing, not on a correction, because weak assets often do not correct.
07:02
How does SMT divergence help in choosing an asset for long?
Look for bullish SMT divergence and prioritize the instrument that shows strength (e.g., Higher Low).
08:42
What is the negative correlation between DXY and currency pairs?
DXY has a negative correlation with EUR, GBP, AUD. If DXY forms a High, the pair forms a Low, and vice versa.
12:19
What is triple SMT divergence?
It occurs when a pair forms three consecutive highs while DXY forms a High-High, Low-High, and another High-High. It is a strong bearish signal.
14:31
In stock indices, which index is prioritized for long positions?
The index that shows strength (e.g., S&P 500 and Nasdaq) is prioritized, while the lagging index (e.g., Dow Jones) may be shorted.
15:15
Definition of SMT Divergence
Core concept of the video, essential for understanding the technique.
01:08Swing Structure Requirement
Key rule for valid divergence, preventing false signals.
02:41Choosing Weak Asset for Short
Practical trading advice that improves entry selection.
06:32Entering on Breakout
Contrarian to common practice, but effective for weak assets.
07:02Triple SMT Divergence
Rare and strong signal, valuable for advanced traders.
14:31[00:02] take a detailed look at one of the most key tools of the smartmali concept - SMT divergence. You'll learn how to easily find and effectively use it in any market, but we'll focus on cryptocurrencies. Next, we'll explore the concept of
[00:17] strong and weak assets, and then how to find areas of interest that are more likely to remain untested. By the way, the file with the excerpt from this lesson is already in my Telegram channel. Save and
[00:29] use as a cheat sheet. In this lesson, we will be discussing intra-market correlation, so we will always need two charts. In always need two charts. In our case, Bitcoin and Ethereum are assets
[00:42] with a strong positive correlation, and they have the same structure. If they have the same structure. If low, high, and overlow are formed for Bitcoin, then exactly the same thing happens for Ethereum . We see
[00:54] . We see loverlow, lhe low. This is healthy pricing, where every move is confirmed by market symmetry. But now look at another situation. A Low has formed in the ether, when at the same
[01:08] time we see a Higher Low here. This asymmetric pricing is called SMT divergence. Her appearance indicates two things. Smart money is actively entering the market and a reversal is beginning. If you see a divergence from below, it is always a
[01:24] bullish signal for growth. Now there is a bearish SMT divergence. Here we look for asymmetry at structural maxima. Bitcoin forms a high, then LX. And on the air during the same period we see the first high and the second. The emerging
[01:41] SMT divergence is a sign of active selling by smart money and the beginning of a reversal in a downward direction. Now look at SMT divergence on real charts. Bitcoin on the left, Ethereum on the right. And immediately an important clarification.
[01:56] You need to compare spot charts from the same exchange. This way you will get more accuracy. For example, I always analyze spot charts, and move on to futures charts when entering a trade. So, bullish SMT divergence. On the
[02:10] Bitcoin chart, Loverlow, Lover and another LLW are forming. Let's look at the same Lover and another LLW are forming. Let's look at the same period on air. First, too, Low and Lhighh, everything is symmetrical here, but then high low appears. And this is already a
[02:25] discrepancy in the structure between the two assets. This is a bullish reversal signal for both. Already at this stage, you can look for long positions. And we will definitely do this, but a little later. First, some important nuances. SMT divergence
[02:41] is determined only by swings. This loverlow is a five-switch swing, and loverlow is a five-switch swing, and this high low is a three-switch swing. It consists of this, this and this candle. The central candle is key because it
[02:55] shows the extreme of the decline, and the candles to the left and right are necessarily above it. At the close of the third candle the pig becomes confirmed. Only from this moment can the smtidivergence be considered valid and
[03:10] used in work. Now we remove the last candle. And here we have a situation where SMT divergence has not yet been confirmed. It is not worth using it in this form, because there is a high probability that it
[03:24] for a reversal. The appearance of another candle and its closing is what you need. This is already a contradiction that can be already a contradiction that can be
[03:39] hourly timeframe. Let me point out right away that SMT divergence works on all timeframes. You can look at a five-minute chart, or at a minute chart. The principles of definition and the logic of its operation remain the same. But it is important to take one thing into account
[03:53] : the possible discrepancy between timeframes. If there is a divergence on the 5-minute timeframe and a bearish one on the hour, the hourly timeframe always has priority. The higher
[04:05] the time frame, the more significant it is. And any contradictions must be resolved precisely according to this principle. On both charts I have highlighted the key swings. Here is the high from which the correction began and its
[04:17] current minimum. Ethereum is also showing the same high and there are no significant differences yet , so let's look at the next candle. We see that the second chart
[04:29] shows the maximum range for Bitcoin. Here it is. And it's not even close to being removed. This is a clear discrepancy. Can we thus determine the SMT divergence or Ether from this high to the high of the last
[04:46] candle? If you listened carefully to what I said in the previous example, you already understand that here and here there is still no full-fledged three-switch swing, and this is the key condition for using cm-divergence.
[05:01] will often find yourself in a situation where the next candle simply renews this high, and then both assets, albeit with a slight delay, will begin to move symmetrically again. This happens regularly and is absolutely abnormal. So always
[05:17] keep that in focus. Let's see what happens next. We define a three-switch swing on Ethereum and a five-switch swing on Bitcoin. After this, we adjust the SMT divergence and tie it to the
[05:32] swing we just marked. We do the same here. This is a strong and accurate indicator of the beginning of a reversal. If you perform your usual analysis without this methodology, there will be no clear
[05:47] signs of a trend change for either Ethereum or Bitcoin. He is generally testing the bulls at this moment, and it is quite possible that you would start looking for long positions here, but that would be a mistake. SMT divergence shows increased smart money activity and does so
[06:01] earlier than any other instrument. A divergence from above is always a bearish self-divergence, which indicates a distribution phase and preparation for an aggressive decline. And only after it forms, you will begin
[06:16] to see the classic signs of downward order flow, inefficiency, order books, changes in structure, and everything else. What do you think is more interesting for me to short in this case : Bitcoin or Ethereum? I think it's clear to everyone that Bitcoin
[06:32] shows weakness by forming an over-high, while Ethereum, on the contrary, demonstrates strength through a high-high. The principle here is simple. If you are considering short positions, you choose a weak asset, it will fall faster, deeper and is more likely
[06:47] to reach your targets. This bullish border block is the downward [music] movement. And this swing is key. Its breakdown will mean that the upper block is
[07:02] no longer relevant and the way will be opened for a further price decline. What would most traders do in this situation ? They will wait for the order block to be broken, then wait for a correction and enter a
[07:16] short position during it, expecting the decline to continue. This is a classic way to enter, and it actually works in most cases, but not in ours. When an asset, in our case Bitcoin, shows weakness, corrections
[07:31] either do not occur at all or are minimal. Don't wait for perfect entry points or deep corrections. This does not happen with a weak asset. The SMT divergence already hints at an aggressive and rapid decline ahead,
[07:46] so a breakout of the key swing is the optimal moment to enter a short. And here is this short position, where the key target is the minimum from which the growth began and the current maximum was formed. Stop-loss is conservative for the piggy bank,
[08:01] Stop-loss is conservative for the piggy bank, reflecting Bitcoin's weakness. Let's look at the work. The deal closed quickly. with a final result of 1: t, which is an excellent
[08:14] result. Now notice this imbalance. In a standard situation, we would wait for it to rebalance and only then look for an entry, but this did not happen. And the fact that we opened here means that we were
[08:26] prepared for this in advance. Let's sum up the interim results. SMT divergence is an early reversal indicator that also helps to choose the right asset to enter. If you are bearish, focus on the weak asset. If it's
[08:42] bullish, look for bullish SMT divergence and prioritize the instrument that prioritize the instrument that shows strength. As you can see from the previous example, SMC divergence helps you determine whether
[08:54] your area of interest will be reached. This is especially true with imbalances like these. Bitcoin is showing weakness, forming a low low, while Ethereum is simultaneously forming a high low. This speaks to its strength, which means that long positions in Ether
[09:07] preferable. This is what our long position will look like. It's great, but in the current situation it's highly unlikely to be realized. The whole point is that this divergence already hints that the asset is ready for
[09:22] rapid and aggressive growth. Don't count on a correction to your zone of interest, otherwise you will simply miss the entry. Start looking for it higher, for example, by current values. If this approach does not suit you, we have an
[09:36] alternative. These are bitcoins. It will be easier to find a long position using it. Locally it does show weakness, but globally it shows strength. And after the update of this svinhai, the roles between him and the broadcast may well
[09:51] change. This sm-divergence tells us that the market is turning around and that we can expect a normal correction for entry. We choose a long position. We begin to balance
[10:03] our entry. We place a stop loss under the second candle of the formation to increase RR. And the take is conditionally on RR 1 ct. Let me point out right away that in
[10:15] real trading, it's better to set take profits on the left side of the chart for key semi-liquidity and problem areas. Let's look at the next candle. We see that the Bitcoin imbalance is partially filled, and our position is successfully
[10:30] . And in such a situation, you would most likely continue to wait for a deeper decline. Now let's look at what happened next. The price just kept going up and your limit order remains
[10:44] unfilled, while in Bitcoin we get excellent execution of a standard long position. In general, SMTDI divergence helps identify not only potential reversals, but also choose an asset for
[10:57] trading, understand the depth of a correction, and assess in advance whether your interest zone will be tested or not. What else can we use besides comparing Bitcoin to Ethereum? I will highlight two key approaches. The first
[11:12] is a comparison of Bitcoin Ethereum and any other altcoin. That is, you are looking for SMG divergence on three charts at once. In this example, Bitcoin shows weakness, while Salan's Ether, on the contrary, shows strength. That is, you are looking for situations where
[11:26] two assets move synchronously, and the third is sucked out of the structure. It gives the is sucked out of the structure. It gives the key signal. The second approach is based on the analysis of correlation by sectors, for example, MMA. The most popular arcs,
[11:40] for example, MMA. The most popular arcs, spikes, pep. An llot and another llow are formed along the arc . The spike is similar. Here is the first pig, here is the second. Appep first low low,
[11:52] and then higher low. That is, liquidity for sale was not removed from this position. The asset shows strength. And it is precisely p that will be considered as a priority. Moreover, in this case, you don’t even need to look at the Bitcoin or
[12:06] Ethereum charts. Here you can look at my study list, divided into sectors. I recommend doing the same. Now let's briefly talk about currency pairs. Here everything is built around the dollar index. Ticker
[12:19] DXY. In the adjacent diagram, substitute the euro, pound, or Australian dollar for X. The dollar index has a negative correlation with them. has a negative correlation with them. If a high is formed on it, then on the
[12:32] If a high is formed on it, then on the euro-dollar chart everything is the opposite. Low Hхайh, but this high low is already a violation of a healthy structure. After all, at the same time, a high high is being formed on the dollar index. This discrepancy is called
[12:45] divergence. It is bearish and points to dollar distribution. On the contrary, for the euro, this is a bullish divergence, signaling accumulation and strength of
[12:57] the currency. Accordingly, in such a situation we will strive to support the euro. Below, the dollar index is forming an upper high, while at the same time here we see Loverol. This is a positive SMT divergence for the currency pair and bearish for the
[13:13] index itself. The DXY is showing weakness, meaning that if it falls, the euro, pound and Australian dollar will rise. Bearish examples for XD pairs and bullish examples for the
[13:25] DXY index work on the same principles. Just mentally swap the diagrams. Here is an excellent example where both types of divergence that we just discussed in the diagrams appear simultaneously. It would be
[13:38] discussed in the diagrams appear simultaneously. It would be positions in the euro even from the current values. Now let's see how pricing develops further
[13:50] positive correlation. The only thing that has changed is the USDX ticker. That is, the dollar is traded against the kenya, the Swiss franc, or the Canadian dollar.
[14:02] If a high low forms here and a low low forms here, it is a bullish SMT divergence. Conversely, if there is a low here and a high low here, that is a divergence indicating strength in the USDX. Accordingly, our priority
[14:18] position is long. Bearish SMC divergence works in exactly the same way, but the decorrelation should be looked for at structural highs. And here is an example. The dollar index forms a high-high, a low-high and
[14:31] another high-high. And the priest will steam the dollar three times in a row, one after the other. This is an example of triple SMT divergence. The fourth point of de-acclimation, as a rule, does not occur anymore, so this is a strong bearish signal about the imminent start of an
[14:46] aggressive decline. Well, let's see how things develop further. look at three charts at once: S&P 500, Dow Jones and Nasdaq. They have a
[15:01] strong correlation with each other, and one of the indices is always either ahead or behind in terms of the movement structure relative to the other two. In our example, the S&P 500 forms a lower low, then a lower high and a higher low.
[15:15] low, then a lower high and a higher low. Dow Jones lowover low, lower high and another overlow. The discrepancy is already visible . Well, and then lower low, lower high, higher low. It turns out that the lagging index is D Jones. It
[15:30] shows weakness compared to the S&P 500 and Nasdaq, meaning they are the priority for long positions. And the Dow Jones, if it remains weak, could be interesting for shorts in the future. The last one is metals.
[15:45] Here is a comparison of gold and silver charts. The logic is exactly the same as in the examples with cryptocurrencies or stock indices. Gold forms a low low, followed by a higher low, while
[15:59] silver's chart shows a lower low and another lower low. This is the bullish reversal and tells us that silver is showing weakness and gold is showing strength. If this key piggy bank is broken, one could immediately enter a long
[16:14] position, placing a conservative stop-loss behind this low. That's all. I hope the material was clear and easy to understand. I have intentionally simplified the topic, although it is certainly much deeper, especially if we analyze the behavior of smart
[16:28] capital in more detail. If you're interested in the topic of smtidivergence, let me know, and I'll prepare an advanced video in which we'll go over everything in detail. Also, in my Telegram channel, you'll find a PDF file with a brief summary of this lesson.
[16:42] Save it using the link in the description. Good luck. Yeah.
⚡ Saved you 0h 16m reading this? Transcribe any YouTube video for free — no signup needed.