
Why Volume Doesn't Work in Forex
60sDebunks a common belief, offering a contrarian view that surprises traders and sparks debate.
▶ Play Clip"Delivers on the promise of a volume strategy with clear examples, though some filler and a generic title."
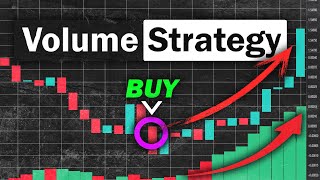
This video explains how to use volume indicators to improve trading profits, focusing on the volume oscillator and the money flow index. The presenter emphasizes that volume is only useful in the stock market, not forex, and demonstrates how to combine volume signals with price action and support/resistance levels.
The video introduces the concept of using volume to maximize profits, emphasizing that trading within a trend is essential but understanding how trends are created by buyers and sellers is key.
Volume indicators are only effective on the stock market because it is centralized, whereas forex is decentralized, making volume data from a single broker meaningless for overall market analysis.
For daily trading, set the volume oscillator to 14 and 28; for shorter timeframes like 15-minute charts, use 5 and 20.
Volume indicates momentum strength, not direction. High volume means strong momentum, low volume means weak. Direction is determined by price action.
If price is in an uptrend but volume is decreasing, the trend is weak and may reverse. The same applies to downtrends.
Using Boeing as an example, a breakout from a range with increasing volume confirms a strong move, providing a sell opportunity.
At a support level, a bullish engulfing pattern combined with increasing volume oscillator indicates a strong buy opportunity.
The money flow index (MFI) signals overbought when crossing above a high line and oversold when crossing below a low line, but should be used with other factors.
On Netflix, a shooting star at resistance with MFI overbought confirms a sell signal.
At a resistance level, MFI overbought and a slight momentum shift indicate a sell opportunity.
The key to profitable trading is aligning volume signals with price action and support/resistance levels. Volume indicators like the volume oscillator and money flow index are powerful tools when used correctly, but they are not standalone signals.
Why does volume work on the stock market but not on forex?
Stock markets are centralized, so volume reflects all trades, while forex is decentralized, so volume from one broker is not representative of the whole market.
00:45
What are the recommended volume oscillator settings for daily and 15-minute charts?
Daily: 14 and 28; 15-minute: 5 and 20.
02:06
What does increasing volume indicate when price is in a downtrend?
It indicates a strong downtrend with strong selling pressure.
03:01
What does decreasing volume in an uptrend suggest?
It suggests a weak uptrend that may be coming to an end.
03:28
What is the Money Flow Index (MFI) used for?
It identifies overbought and oversold conditions, signaling potential reversals.
05:45
Volume Only Works on Stocks
Clarifies a common misconception about volume in forex, saving traders from using ineffective indicators.
00:45Volume as Fuel
Provides a simple analogy to understand volume's role in momentum, making the concept accessible.
02:33Breakout Confirmation with Volume
Demonstrates a practical application of volume to confirm breakouts, a key technique for traders.
04:08MFI as a Bonus Indicator
Introduces an additional volume-based indicator that can enhance trading strategies when combined with other signals.
05:45[00:03] i'm revealing how you can maximize your profits using the concept of volume so we all know that in order to become a profitable trader you need to trade within a trend but have you ever stopped and think about
[00:17] creating those trends traders tend to forget that there are other people on the other side that is moving the market trend lines but at the end of the day if there aren't
[00:31] any buyers or sellers a stock will not move and a good way to know this is to look at the volume before i start i'd like to give a really important info that i rarely see from other trading
[00:45] channels volume only works on the stock market it doesn't work on the forex market let me explain so a stock market meaning all the trades are routed towards one
[01:00] central exchange however a forex market is considered as a decentralized market meaning there is no one location where the currencies are traded so for example if your broker is iq
[01:14] if you're using seeing is actually the volume that people are trading with that particular broker let me give you an example
[01:27] if you open trading view you can actually see that the broker seeing here is the volume that people are trading with the owanda broker so this is why volume on forex is
[01:40] completely useless because the main goal of knowing the volume is to know where big institutions are putting their money and if different institutions have different brokers meaning there is no exact way of
[01:53] identifying how much total money is put in a currency so in this video i'm going to reveal how you can increase your chances of profits using a volume indicator that i personally use which is the volume
[02:06] oscillator if you open the volume oscillator on trading view this is what it looks like we have a plot line and a zero line in the middle for the settings if you're trading using
[02:19] you want to put your settings as 14 and 28 but if you're trading a shorter time frame like the 15 minute chart then we're using the 5 and 20. so this is how you read the volume
[02:33] oscillator first you need to know that volume doesn't indicate the direction of a trend a volume is basically like the fuel or the energy so if the volume is low meaning that the
[02:46] momentum is weak and if the volume is high meaning the momentum is strong so to know the direction of the momentum you need to look at price action if the price is heading upwards
[03:01] and the volume is also increasing meaning that it's a strong upwards trend and if the price is heading downwards and the volume is increasing this means that it's a strong downtrend remember
[03:15] volume is like a fuel so if the price is already heading downwards an increase in volume will result in a stronger downtrend a volume can also tell you how strong a trend is
[03:28] for example if a price is on an uptrend yet the volume is constantly decreasing meaning that it's a weak uptrend and you should be careful if you're taking a buy because this could indicate that the trend may come to an end
[03:43] it's also the same for downtrends if the price is on a downtrend and the volume is decreasing meaning that the momentum to the downside is weak therefore you need to be careful if you're taking a short position
[03:56] because a low volume could mean that the trend is coming to an end with volume is with simple price action
[04:08] so here's the boeing chart and as you can see the price moved support and resistance line here and when the price was trading on a range we can see that the volume is relatively
[04:22] low now look at what happened the price broke out of the range area downwards while the volume started going up increase in selling pressure to the downside
[04:36] so this is a good opportunity to take a sell position so let's move on to another chart here we have bank of america this level and up again making this a key support
[04:51] line and as prices went back to this level again we spotted a bullish engulfing pattern which is a bullish signal and the volume oscillator is also
[05:03] increasing so let's do a quick recap prices are at the support level a bullish engulfing pattern formed against that support level and the volume oscillator is increasing
[05:16] upside so this is a good opportunity to take a buy position so the key to having a profitable is making sure that all the signals are aligned you cannot simply take a buy
[05:31] because a bullish engulfing formed you need to take into account other market factors like support and resistance so that's how you combine volume with price action and now i'm going to give you a bonus
[05:45] using another volume indicator called the money flow index so how the indicator works is very simple if the line crosses above the high line meaning that the price is overbought
[05:58] and is more likely to reverse to the downside line meaning that the price is considered oversold and is more likely to reverse to the upside but like i said before you cannot simply
[06:14] buy or sell based on the indicator alone you need to take into account other in this case we are also using support and resistance so let's jump into a chart here's netflix
[06:27] and as we can see prices approaches this zone here and it started to reverse making this a resistance level resistance level again this time displaying a fake out where a
[06:42] candle went up here and closes again below here and if you know basic candlestick patterns you will know that this is a shooting star which is a bearish pattern next you can see a big red candle formed
[06:57] after that and also the money flow index is at the overbought levels which further confirms that the price is heading towards the downside so this is a good opportunity to sell
[07:09] the market let's look at another example here we and as you can see when prices hits this it reverses downwards making this a key resistance level
[07:23] so as prices approaches this level again we can see a slight momentum to the while the money flow index is at the overbought levels sell position [Music]
[07:37] so i just revealed to you the best strategies that you can use with two volume indicators and all i ask for in return is a very small favor of liking the video and subscribe to the channel
[07:50] it literally takes only two clicks and it means so much to me and in return i'll produce more high quality trading videos like this every single week so thank you guys for watching and i'll see you in the next
[08:03] watching and i'll see you in the next video




⚡ Saved you 0h 08m reading this? Transcribe any YouTube video for free — no signup needed.