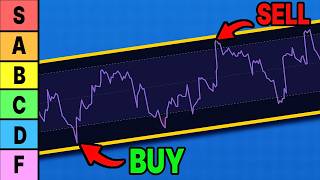

Why MACD is F-tier
55sStrong controversial opinion about a popular indicator, with a memorable analogy.
▶ Play Clip"Delivers on the ranking promise with clear justifications, but the constant Telegram plugs and repetitive 'stay with me' filler drag it down."
This video ranks the most popular trading indicators from S to F tier based on their profitability, arguing that many common indicators are lagging and ineffective in modern markets. The creator provides a critical analysis of each indicator, highlighting their flaws and strengths, and ultimately crowns volume as the only S-tier indicator due to its unique measurement of market conviction.
The video ranks major trading indicators from S to F tier based on whether they actually make money, arguing that many are designed to be late rather than wrong.
MACD is a lagging indicator built on another lagging indicator, resulting in delayed signals. In the 2022 bear market, MACD crossover signals were late by an average of 11 days.
Higher timeframe moving averages (50/200-day or week) work because they reflect actual market averages and are used by major institutions, creating collective attention and real buying/selling.
Stochastics is like MACD with extra noise. It worked in the 1980s but is now arbitraged away by algorithms, making it less effective in today's market.
RSI measures momentum but is often used incorrectly. The overbought/oversold signals are unreliable; for example, crude oil stayed overbought for 34 days in 2022 while price kept climbing. RSI divergence is the only valuable use.
Bollinger Bands indicate volatility, not direction. They act like a smoke alarm, telling you when to pay attention but not where to go.
Donchian Channels show the highest high and lowest low over the last 20 periods. A breakout signals significant market movement, making it simple and powerful.
Fibonacci levels have no economic justification but hold due to psychological patterns. The 'golden zone' between 0.618 and 0.5 retracement often acts as support/resistance.
Volume is the only indicator that measures actual conviction and participation, not just repackaged price data. Weak volume on rising prices signals weakness, and weak volume on falling prices signals seller exhaustion.
The main takeaway is that most retail traders layer indicators derived from the same price data, creating noise. Trusting volume and understanding how to read it is the key to better trading decisions.
Why is MACD considered a lagging indicator?
Because it is built on top of another lagging indicator, resulting in delayed signals.
00:27
What was the average delay of MACD crossover signals in the 2022 bear market?
11 days.
00:40
Why do simple moving averages work according to the video?
Because they take into account actual averages of the market, and data based on averages is useful; institutions use them, creating collective attention.
01:27
What is the main problem with stochastics in today's market?
The math that made it work in the 1980s is being arbitraged away by algorithms, and it pins to the ceiling in trending markets.
03:01
What is the only valuable use of RSI according to the video?
Using RSI divergence, where price makes higher highs but RSI makes lower highs, indicating loss of momentum.
04:33
What do Bollinger Bands actually measure?
Volatility, not direction.
05:00
What does a breakout from a Donchian Channel indicate?
The market is doing something it hasn't done in a full month, signaling significant news or volatility.
05:25
Why do Fibonacci levels hold despite having no economic justification?
Because of psychological patterns found in nature and human behavior.
06:09
What is the 'golden zone' in Fibonacci trading?
The zone between the 0.236 and 0.5 retracement levels, where price often reverses.
06:37
Why is volume considered the only S-tier indicator?
Because it measures actual conviction and participation, not just repackaged price data, and shows real-time market strength.
07:02
MACD is a lagging indicator
Highlights a common misconception and provides a concrete example of its delay.
00:27Moving averages work due to collective attention
Explains the psychological and institutional basis for why simple indicators can be effective.
01:27RSI overbought is unreliable
Provides a real-world example (crude oil) showing the danger of relying on overbought signals.
03:28Volume measures conviction
Distinguishes volume from all other indicators as the only one measuring actual market participation.
07:02Layering indicators creates noise
The core takeaway that most traders use redundant indicators, leading to confusion.
08:36[00:01] them. Some of them work, some of them don't. The reality is not all indicators are created equal and most traders are using indicators that are literally designed to lose nowadays. Not necessarily designed to be wrong,
[00:14] designed to be late and I can prove it. I've ranked every major trading indicator out there, S tier down to F tier, based on one thing. Does it actually make you money? I mean, that's what we all care about, right? And the
[00:27] one that lands at the very top, it's probably not what you think. Stay with me. MACD, ooh, MACD, F tier. There it is. I said it. MACD is a lagging indicator built on top of another lagging indicator. You're literally
[00:40] watching a delayed signal of a delayed signal. Think of your Grandma Dolores. That's the MACD. Sorry, Dolores. In the 2022 bear market, MACD crossover signals were late by an average of 11 days. 11 days, meaning the market crashed for 11
[00:56] days before the MACD signal told you to sell. Yeah. Pretty useful. Do you know the amount of drawdown that could occur in 11 days? The answer, a lot. A lot can happen in 11 days. But, here's the thing. The problem isn't just the MACD.
[01:11] There's a lot of indicators on this list with flaws. All of them besides one. Next, simple moving averages, A tier. Specifically talking about the higher time frame moving averages, like the 50 and 200-day or the 50 and 200-week
[01:27] moving averages. I want to be extremely clear about why these work. It's not because the math of the indicator is so sophisticated. It's actually quite the opposite. It works because it's taking into account actual averages of the
[01:39] market and data based on averages is actually pretty useful when it comes to trading. Every single major institution uses these in some type of way. Pension funds, CTAs, hedge funds, when price hits the 200-day moving average,
[01:54] everyone sees it. That collective attention creates real buying or selling of the best traders to ever live, even said, "If all you ever did was buy high-quality stocks on the 200-week
[02:07] moving average, you would beat the S&P 500 by a large margin over time." That strategy has been statistically proven to work. The problem is few people have that kind of discipline to wait for price to actually hit the 200-week
[02:22] moving average. I actually made a complete guide on how I use moving averages in my own personal strategy, and it's been working amazing. I just posted it in my Telegram. It's open to everyone, and completely free to join. I
[02:35] made it for the sole purpose of helping out my viewers. So, yeah, I'll leave a link in my description if you want to check that out. But, I use these every single week in my trading analysis, and I'd highly recommend you do as well. On
[02:48] to the next. Stochastics, D tier. This is basically MACD with some extra noise turned on. In a trending market, the stochastics indicator pins to the ceiling and stays there, which basically tells you nothing. In a choppy market,
[03:01] it boomerangs you in and out of your positions until your account balance looks like this. Stochastics actually worked very well in the 1980s, when humans were literally yelling at each other in the stock pit
[03:14] like a bunch of monkeys. Now, 70% of trading is algorithmic. That math that made stochastics work in the 1980s doesn't necessarily work in today's market, because that math is being arbitraged away in milliseconds by
[03:28] automatic algorithms. Not that useful. Next. RSI, C tier. I like the RSI because it actually has some relative value. RSI measures momentum. That's it. The problem is most traders are taught to use it completely wrong. If I had to
[03:42] guess, you were probably told to use the RSI as follows. Buy when the RSI goes below the oversold area, sell when the RSI goes above the overbought area.
[03:54] Which, if you've actually used it like this, you'd probably quickly figure out it doesn't work very well. Just because the RSI indicator is in the overbought, doesn't really mean anything. It just means the chart has high momentum.
[04:07] Which, even if the RSI is {quote} {unquote} overbought, the chart can easily keep going up. Go back to say 2022 for example. Crude oil stayed overbought on the RSI for 34 consecutive days. While the price just kept
[04:21] climbing. 34 days. Meaning, if you shorted crude oil just because the RSI said overbought, you'd get absolutely obliterated for 34 days. The only place
[04:33] RSI adds real value, in my humble opinion, is if you use it for divergence. For example, when price is making higher highs, but RSI is making lower highs, that's a signal worth paying attention to. This shows the
[04:47] chart is losing momentum, even though the price is still going up, which can often lead to price crashing, just like it did here. So, if you use RSI divergences, it can be pretty useful. Otherwise, I'm not touching it. Next,
[05:00] Bollinger Bands. B-tier. Great indicator, but here's where people get it wrong. Bollinger Bands don't tell you direction. They tell you volatility. They tell you when to start paying attention. You can almost think of them
[05:12] like a smoke alarm. That alarm going off doesn't tell you where the fire is, but it tells you the fire exists. You still need another signal to tell you which direction to run, but at least you know there's a
[05:25] >> I said, "Oh Lord Jesus, it's a fire." >> And then, there's Donchian Channels. A-tier, baby. This is the highest high and the lowest low over the last 20 that. When price breaks out of a Donchian Channel, it means the market is
[05:40] doing something it hasn't done in a full month. That's a signal worth paying attention to. Whenever this happens, it probably means there's significant news, volatility, or something major is happening. Simple, clean, and if you use
[05:54] it correctly, can be extremely powerful. As my grandmother Delores said, simple is always better, always. Fibonacci, how could I forget Fibonacci? B tier. There is zero economic justification for why Fibonacci levels should hold, none. The
[06:09] math behind it is not connected to market fundamentals in any rigorous way. And yet, the level still hold. Why? Because patterns. The Fibonacci sequence is a mathematical equation found all over in everyday life. Flower petals,
[06:23] sunflowers, hurricanes, the universe, and even your ear. Which a lot of people believe these same patterns are involved with human psychology around charts. My favorite way of using it, pause the video, copy these exact levels. This
[06:37] will leave you with this zone, which I like to call the golden zone. mark from the low of the trend to the high of the trend. Once marked, it'll
[06:50] leave the golden zone. More often than not, price will retrace back to the golden zone and reverse at this exact point. It's actually a pretty astonishing at how often this works. I'm telling you, go check it out for
[07:02] moment you've all been waiting for, the only indicator to hit S tier on the tier list, volume. And honestly, it's not even close. Here's why volume is in a completely different category from every
[07:15] other indicator on this list. Every other indicator is just repackaging price data. They're all downstream of the same input. MACD, RSI, stochastics, they're all lagging indicators. Volume is the only indicator that measures
[07:29] something different entirely. It measures actual conviction. It measures participation. But most importantly, it shows you in real time. See, if we look at this chart, price is moving upwards. We're making higher highs and higher
[07:42] lows. So, if you are a price action trader and looking at price action and price action alone, you'd be sitting there thinking this is a very strong uptrend. But, the moment we look at the volume, it tells us a completely
[07:56] different story. Even though the price is going up, the volume is getting weaker. With every new high that price is making, there is less and less transactions happening and the volume is getting smaller, which shows weakness.
[08:10] With this weakness, you could easily predict the price is about to fall because of the lack of volume, which is exactly what happens. The same exact thinking goes for the opposite scenario. If we have a strong downtrend, price
[08:23] making lower lows and lower highs, but we look at the volume and the volume is getting weaker as well, this is showing the sellers are getting exhausted. Each drop in price has less and less transactions, which means the selling is
[08:36] getting weaker, which often signals a bottom is forming. Which again is takeaway from this video isn't the rankings. It's this. Most retail traders are layering indicator on top of indicator, all derived from the same
[08:51] data, all giving them slightly different versions of the same wrong delayed answer. It's purely just noise in my opinion. Now you know which indicators to trust, the harder question is knowing how to read them. If you want to know
[09:03] how I use indicators on the top of this tier list, I explain it in my Telegram. Just click the link in my description. It's completely free to join. I'll see It's completely free to join. I'll see you in there.
⚡ Saved you 0h 09m reading this? Transcribe any YouTube video for free — no signup needed.



![BEST MACD Trading Strategy [86% Win Rate]](https://img.youtube.com/vi/rf_EQvubKlk/mqdefault.jpg)