
Day Trading Setup Exposed
45sViewers love to see the exact indicators and strategy used by a profitable trader.
▶ Play Clip"Delivers the promised profit, but the content is a thin trade recap rather than a real educational breakdown."
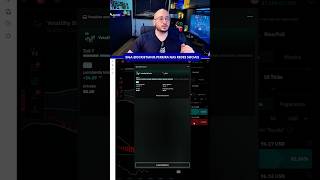
The video shows a manual day trading session on Deriv's Volatility 50 index, using Bollinger Bands, MACD, RSI, and support/resistance levels. The trader makes three small $1 bets, wins all three, and ends with a profit of R$690.
Trader logs into Derive brokerage on Volatility 50 with Bollinger Bands, MACD, RSI, and support/resistance levels.
Identifies support/resistance zones aligned with indicators, places small $1 contracts on price increases or decreases, with 2-3 entries and a GO bet to recover losses.
Volatility 50 recently fell, Bollinger Bands widened, MACD parallel to signal line; first entry placed at a low point expecting continued downtrend.
First entry ends on the last tick, securing a win of 46.14.
Market trades below the middle Bollinger Band and MACD points down; another devaluation entry wins 46.14, bringing total to 92.28.
Asset continues in the region, expected to target the lower band; trader adds 10 ticks and continues the downward trend.
Nine ticks in, another win of 46.14. Three entries, three gains, total 138.42.
Three entries and three gains of 138.42, stated as 692 in profit (matching the title's R$690).
Trader promises educational content and asks to follow @occristiano.pereira.
What trading indicators does the trader use in the video?
Bollinger Bands, MACD, RSI, and support/resistance levels.
00:01
What is the initial bet size used by the trader?
$1.
00:15
How much profit did each winning trade generate?
46.14.
00:58
How many trades were executed in the video?
Three.
02:09
What is the total profit from the three trades?
138.42 (stated as 692 in profit).
02:33
What does the trader plan to do if a trade results in a loss?
Make a GO bet to recoup losses and make a profit.
00:29
Confluence of indicators
The trader aligns support/resistance with MACD and Bollinger Bands to increase trade probability.
00:15Risk management with small bets
Using $1 bets limits downside while allowing multiple entries.
00:29Consistent wins
Three consecutive wins demonstrate the strategy's short-term effectiveness.
02:09Profit claim
The stated profit of R$690 matches the video title, confirming the result.
02:33[00:00] Fala seus traders, tudo bem com vocês? Hoje vamos voltar aos trabalhos e nada melhor do que retomar com o Day Trade Manual aqui na corretora Derive. Já estou logado na minha conta, aqui na Volatilidade 50, com o meu setup principal,
[00:14] que são bandas de Bollinger, MACD, RSI e também suporte e resistência. Sempre estou identificando zonas de suporte e zonas de resistência para ver se entra em confluência com meus outros indicadores e eu faça o meu contrato,
[00:27] tanto em valorização quanto em desvalorização. Metinha de 100 dólares aí, praticamente duas a três entradas, caso eu não venha a tomar loss, se não eu faço um gale aí para já buscar o meu prejuízo e ganhar um lucro no mercado, beleza?
[00:41] Vamos lá começar com as nossas entradas. O mercado aqui, a volatilidade 50 veio de uma queda recente, está com as bandas de Bollinger bem expandidas e um MACD ficando paralelo em relação à linha de sinal.
[00:55] O que eu vou fazer aqui? Minha primeira entrada, vamos fazer uma entrada em desvalorização, tá? Buscando que o mercado continue apenas a queda dele. Entrando com a primeira entrada aí. Vamos ver, ó.
[01:08] Finalizou no meu último tick, pegou uma win de 46.14. Vou colocar aqui 46.14 na minha calculadora. Mercado continua trabalhando aqui abaixo da linha média da banda de Bollinger.
[01:20] Temos aqui o meu MACD voltando a apontar para baixo. vou fazer mais uma na desvaloriza Vamos ver eu n estou achando que esse mercado est com for comprador o suficiente para buscar minha linha m Vamos ver a mais uma entradinha efetuada mais uma win mais 46
[01:39] Vou colocar na minha calculadora, 46.14, já são 92 dólares e 28 centos. Está vendo que o ativo continua se movimentando nessa região? Eu estou achando que ele vai buscar novamente a banda inferior.
[01:51] Vamos colocar 10 ticks agora, continuando na desvalorização. Vamos ver. 10 ticks de contrato agora. Se eu pego uma win, já bato a minha meta. Se eu pego um loss, eu vou para o meu primeiro Gale.
[02:06] Vamos ver aí. Movimentação. Aí, vamos ver. 9 ticks em win. Beleza, mais 46 e 14. Um perfect, né? 3 entradas e 3 gains.
[02:18] total de 138,42 dólares. Está vendo? As minhas três bandeirinhas verdes aqui, eu estou achando que o ativo pode buscar a banda inferior, continuaria fazendo entradas em desvalorização,
[02:31] só que agora dando um tempo maior de contrato. Mas é isso aí. Para o primeiro vídeo, de volta aos trabalhos, três entradas e três gains, 138,42. Isso daqui, 138,42.
[02:43] 692 reais de lucro nesse pouco espaço de tempo. Já me segue aí. Vou voltar com conteúdo tanto educativo quanto também de day trade online, beleza? Então é isso, galera. Segue aí, arrobaocristiano.pereira, tanto aqui no Instagram quanto também no YouTube.




⚡ Saved you 0h 02m reading this? Transcribe any YouTube video for free — no signup needed.