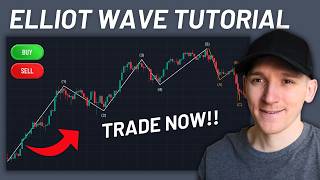

What is Elliott Wave? The 5-Wave Pattern Explained
45sBreaks down a complex trading concept into a simple 5-wave pattern that beginners can easily grasp and visualize.
▶ Play Clip"Delivers a solid beginner tutorial on Elliott Wave, but the title oversells 'trading' without deep entry/exit strategies."
This video is a beginner-friendly tutorial on Elliott Wave theory, explaining how to use the Elliott Wave drawing tool in TradingView to identify impulse and correction waves for trading. The presenter demonstrates how to draw these waves, combine them with Fibonacci retracements and extensions, and use the RSI indicator for confluence to make trading decisions.
The Elliott Wave tool is available in most trading software, including the free version of TradingView. It breaks down price moves into five impulse waves and a three-wave correction (ABC).
In TradingView, select the Elliott Wave tool from the left-hand side. Choose 'Impulse' and click to place points: start, wave 1, wave 2, wave 3, wave 4, and wave 5. The tool auto-fits the waves.
Longer timeframes (weekly, daily) give stronger signals. Lower timeframes (1-hour, 2-hour) have lower confidence. There is room for interpretation in where waves start and end.
In settings, adjust the 'degree' to match your timeframe: intermediate for daily/4-hour, higher degrees for swing trading on weekly/monthly. You can also customize colors and thickness.
Use the Fibonacci retracement tool to identify pullback levels (38.2%, 50%, 61.8%) within a trend. These levels often coincide with wave 2 and wave 4 pullbacks, providing confluence.
Elliott Wave theory suggests that wave 3 is the largest and strongest move. After wave 5, the trend is losing momentum.
The Relative Strength Index (RSI) can confirm loss of momentum. If price makes a higher high but RSI makes a lower high, it indicates bearish divergence, suggesting the end of the move.
After a five-wave impulse, a larger correction occurs, typically in an ABC pattern: A (down), B (recovery), C (down). Use the trend-based Fibonacci extension to project where C might end.
Plot the trend-based fib extension starting at wave 5 (A), then to the correction low (B), and the recovery high (C). The extension levels project potential targets for the next move.
Elliott Wave theory, combined with Fibonacci and RSI, provides a framework for identifying potential trend reversals and continuation points. While it requires practice and interpretation, it can be a valuable tool for traders on higher timeframes.
What is the Elliott Wave theory?
It breaks down price moves into five impulse waves and a three-wave correction (ABC).
00:15
Which wave is typically the strongest?
Wave 3 is the largest and strongest move.
05:08
What are the key Fibonacci retracement levels?
38.2%, 50%, and 61.8%.
04:26
How does RSI confirm the end of a move?
Bearish divergence: price makes a higher high but RSI makes a lower high.
05:52
What is the ABC correction pattern?
A down move, a recovery (B), and a final down move (C).
07:21
What tool is used to project the end of wave C?
Trend-based Fibonacci extension.
08:00
Wave 3 is the strongest
This is a core principle of Elliott Wave theory, guiding traders to focus on wave 3 for the biggest moves.
05:08RSI divergence as confluence
Combining RSI with Elliott Wave adds objective confirmation to subjective wave counts.
05:38Longer timeframes are stronger
This is a key insight for traders: higher timeframes yield more reliable signals.
02:20[00:01] the Elliott Wave drawing tool and how to use it to trade. So, we can use this on anything else. And pretty much every trading software has this. I'll show you TradingView is completely free. You can use it for free. So, I'll link them
[00:15] What exactly is Elliott Wave? Well, it was named after the founder. But, what this does is it breaks down moves in prices into five waves. These are known as impulse waves. And there's an a wave, a correction, a wave,
[00:31] can plot these on our chart and then hopefully we can use those to go ahead and trade and make entries. You should be able to easily find Elliott Wave on on the left-hand side, once you've got your chart up, you want to come to the
[00:44] left and then just click on this one right here. You want to click the drop options. Elliott Waves. I'll show you the impulse and correction waves here. 5. That is essentially a an amount of price
[00:59] action. So, what happens is you draw the first point. You then have a wave Then you have a drawdown. Then you have the big move, another drawdown, and then the last move. Now, these are the starts of the trend.
[01:15] a correction, right? You have a move here. People obviously sell into it. Right? Cuz they're thinking that usually you get a downtrend like this, and then you get obviously the next move, right? So, you get move up. You get a little
[01:28] short-term profits. But, then you get the bigger move higher as a price actually moves. You get a lot of trend following here. A lot of people piling And then, of course, you get another correction here where everyone says
[01:41] actually this is towards the end of the move, according to Elliott Wave theory, right? So, what you're seeing here is that this is the beginning of the move. This is the end of the move. And this is the kind of bulk of that price move.
[01:54] And so, we can go ahead, look at the chart, try and put these waves on, and ahead and trade, right? Maybe you want to trade this pullback. Maybe you want just trend follow along with everyone else. But certainly up here,
[02:07] because they see this moving again, so they think that the price is going a lot higher. According to Elliott wave, this is actually the end of the move. Uh and you're looking at Elliott waves and the price moving up here as well. Just like
[02:20] using any other technical analysis tool, there is room for interpretation when you start your Elliott waves, where you finish them, where the pullbacks happen, at time frames as well. So I'm going to be looking at the weekly chart. Usually
[02:35] with technical analysis, the longer the time frame, the stronger the analysis will be. If you're going down to the 1-hour or 2-hour, things can change dramatically. The confidence is definitely lower here, but Elliott wave
[02:47] frame. So if you're day trading or swing trading, it should be absolutely fine. just as an example. So we're going to put this Elliott wave uh on the chart right here. So we're looking at a impulse wave, right? A trend to the
[03:00] upside. So let's say that we start our trend here. So we have obviously the first move up, down, another pullback up to the high.
[03:14] this kind of works because we've got an uptrend here. Five should be the end of fitted it here. But like I said, there's a lot of room for interpretation. Come to your settings and look at the degree here.
[03:28] You can see it's auto fitted to intermediate. If you're looking at lower daily, 4-hour, something like that, you might want to go down to these options frames. Now if you're looking at swing trading
[03:43] or monthly, you want to be going up to these higher degrees here, right? And the color and everything else, you can the thickness of the wave if you want. And then press okay. So now we we've got
[03:57] our waves, right? The beginning have the first impulse, pull back, end of the trend. Traders will often use Elliott wave along with Fibonacci as pull backs in a trend. So if you want to use a Fibonacci, come to this icon on
[04:12] TradingView, fib retracement. Now we look at fib retracements here. So we have the start of a trend, so let's put that in the exact same place and go up here. Now for a pull back
[04:26] looking at these three key key levels, right? 38.2, .5, and 61.8. And as you can see the price did essentially just come right back into these. So you'd be retracements as well. I'm just going to show you my settings here if you want to
[04:42] copy them. Fib doesn't look like this originally. I've um put the most important levels here and just change the style, so you can screenshot this if you want to copy my style and the levels as well. But using fib retracements here
[04:55] after a big wave, the retracement would be expected to come to come into these happened, and you can use that with Elliott wave just for confluence as well. Elliott wave theory suggests that the bulk of the price move during this
[05:08] price action, these waves, comes from two to three. This is where you'll get the biggest move in the price, the the trend. Now it's not always perfect, but essentially it's saying that right here is really most of the move, right?
[05:24] end of the move, even though the price may go to the high or even higher it's really running out of momentum. The move. That's what Elliott wave theory suggests. Now what you can do for
[05:38] actually happening is look at something like the RSI. So if you go to indicators, just type in RSI here. Relative strength index. Now, relative strength index shows us the strength of the price move. So, even
[05:52] though up here, this price is higher than this one, it is showing us that the relative strength of that price movement is smaller and lower. That is showing us
[06:04] out of steam, and you can see that here, right? So, the relative strength index It's not as strong. Right? The price movement isn't as strong. And that's confluence here, showing that yes, this movement is
[06:17] Elliott wave would suggest that four to five, this is the ending of that move. So, RSI is showing that as well. Now, of course, things can happen in the Some piece of news comes out or something like that. Suddenly, the
[06:30] market has more legs. Uh but according to Elliott wave theory, technical this should be nearing the end of the move. The down, moving actually into another correction. And that's what RSI is
[06:44] look at the correction waves as well. So, according to Elliott wave theory, we've had this uptrend, we've had this move. Wave five is the end of the move here. And so, we'd be looking for a larger correction. Where most traders
[06:56] here, and then we actually get another move higher. According to Elliott wave theory, because we've had four and five, larger correction. But the important thing is to know how we actually chart
[07:09] and predict here. The way that Elliott correction waves works, so we'll go to the left-hand side again. We'll click the correction wave. This is an ABC. So, I essentially have the price high, you have a correction,
[07:21] you have a dead cat bounce or a recovery where uh traders think that this is happens is it just reverses again into the new low. So, you have ABC. So, what correction, small recovery, and then actually a move lower.
[07:36] going to be on here, right? And of course, this price action won't be here when we're looking at the live chart. So, what you're looking for is a correction here and then maybe a small bounce.
[07:48] and then maybe a small bounce. So, if you go to A ABC, this would be A, B with the correction, but where's C going to go? We don't know. Do we draw it down here? Do we draw it here? It's difficult, right? We don't know that.
[08:00] What we can use now is Fibonacci again to try and figure out where the price do now is go to the trend-based fib extension. Click this. You want to start move according to Elliott Wave theory, right? So, start at number five, that
[08:15] would be A. You need to wait until B and C or uh B is actually plotted as well. So, you have the downward correction, then you have the recovery here. So, you would plot A
[08:27] to the correction and the recovery like this. Move it across. And according to the trend-based fib this would be the level that we'd be looking at for the ultimate move.
[08:40] Remember, we don't know this price action yet. We would have seen this small correction or recovery here, so the correction and recovery, and now according to Elliott Wave theory, where
[08:53] C will get to. I'll just show you the settings on my So, you can copy this. Just write this down or screenshot. All potentially where the price may get to,
[09:07] Somewhere around here. So, the correction Elliott Waves, you can't draw these on cuz the price action won't be here. But, it should look. According to Elliott Wave theory, correction, small recovery,
[09:22] correction again. You can use Fibonacci to actually figure out if that's playing out, right? If it's gone from A small into B, now it's starting to drop again, where will the price potentially get to? You can start to place trades here,
[09:35] maybe actually start to go long again if you're bullish. or of course up here certainly not buy here if you're short-term trading because you may fall lots more in-depth trading guides, I've got those linked in the description and
[09:47] exchanges I use will be down in the description as well. I'm James from watching and I'll see you in the next one.
⚡ Saved you 0h 09m reading this? Transcribe any YouTube video for free — no signup needed.