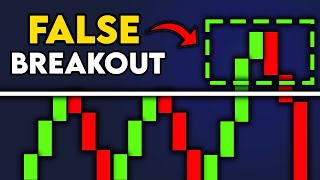

The False Breakout Trap
60sIt vividly describes a relatable trading failure, hooking viewers with a common pain point.
▶ Play Clip"The title promises a new technique to avoid false breakouts, and the video delivers a coherent strategy based on liquidity and fair value gaps, though it's padded with some filler and a promo at the end."
This video explains why false breakouts occur in trading and introduces a strategy to avoid them by understanding market liquidity and fair value gaps. The presenter argues that markets are driven by liquidity, and price naturally moves toward areas where stop losses are clustered, creating opportunities for large institutions.
A common trading scenario: price retests a high, breaks it, but then reverses, causing traders to lose money. This is identified as one of the most common ways traders lose money.
Markets are driven by liquidity, which acts as fuel. Without liquidity, the market wouldn't move. Stop losses are clustered below lows, and price naturally moves toward them.
Hedge funds and private equity firms use stop losses as liquidity to enter large positions. When price breaks a low, it triggers stop losses, allowing institutions to enter.
Equal highs and lows are not just support/resistance but are points of liquidity. These are areas where price will likely target.
A fair value gap is created when price moves rapidly, leaving an imbalance. It's marked from the wick before the big candle to the wick after it. Price tends to return to fill these gaps.
On higher timeframes, there is often a bullish fair value gap below liquidity and a bearish fair value gap above highs. Price will naturally move to these gaps, creating a cycle.
Price continuously seeks liquidity and imbalances. To go higher, price must first go lower (to take liquidity), and vice versa. This cycle repeats indefinitely.
The key takeaway is to view the market through the lens of liquidity and imbalances. Price always seeks out liquidity and fair value gaps, and understanding this can help traders avoid false breakouts and anticipate market moves.
What is the most common way traders lose money according to the video?
Entering into a false breakout.
00:53
What is liquidity in the context of trading?
Liquidity is fuel for the market to move; without it, the market wouldn't move.
01:21
How do hedge funds use stop losses?
They use stop losses as liquidity to enter big positions.
02:17
What is a fair value gap?
A fair value gap is when price moves up or down an insane amount, creating an imbalance in the market.
02:56
How do you mark a fair value gap?
Mark the area from the wick before the big candle to the wick after the big candle.
03:11
What two things does price always look for?
Liquidity and imbalances.
06:05
What happens if you want price to go higher?
You actually need price to go lower first.
06:21
Liquidity as Market Fuel
This is the core principle that explains why false breakouts happen and how to predict them.
01:21Institutional Use of Stop Losses
Reveals the hidden mechanics of how large players profit from retail traders' stop losses.
02:17Fair Value Gap Definition
Provides a clear, actionable definition of a key technical concept.
02:56Price Always Seeks Liquidity and Imbalances
Summarizes the entire strategy into a memorable, testable rule.
06:05[00:00] setup. Where price made a high, retracted back down, and came back to test this high again. You watch closely as the candle slowly starts to come to this resistance point.
[00:13] Tons of volume starts coming in and more and more buyers are starting to enter. The candle is getting bigger and bigger. You wait eagerly to enter as once price breaks this high. You expect the price to sky rocket and make a ton of money.
[00:27] And then suddenly it happens. You quickly go to broker and the gains come into your account. But wait, whats happening?
[00:39] The price is starting to slow down. Oh no, its starting to reverse. What? It s crashing? And it turns out, you entered into a false breakout and lost all your money. Well what if I told you, this is one the
[00:53] most common ways traders lose money. If only there was a way to avoid these false break outs completely and make sure this never happens to you again. I found a brand new technique to make sure this never happens to you ever again.
[01:09] And you can actually capitalize on moves just like this one and know they are Well to understand why this move happened we first have to understand what caused it.
[01:21] And the answer is liquidity. Ya see, the markets are ran based off liquidity. In other words, liquidity is basically fuel for the market to move. Without liquidity, the market wouldn t move. Let me paint you a picture.
[01:34] If you were in a long trade in this specific example, where would you set your stop loss? Well most traders are going to set their stop loss right below this low probably. As if price goes below this low you d expect the price action to turn
[01:47] bearish and continue to head downwards. And you aren t doing this, a majority of the market as this exact same style of thinking. So what ends up happening, is a lot of stop loss orders are going to be set in this area. So price is naturally going
[02:01] to want to head towards it. And once prices breaks this low, its going to trigger all these stop losses. But the big hedge funds and private equity firms know this, and they use all of these stop losses as liquidity to enter big positions.
[02:17] So often times, price will do this break, the big companies will enter their positions, or in other words. Creating liquidity. The market is ran by liquidity. Once you realize
[02:30] actually what drive price in a certain direction. So how can we make a strategy based off of this information to make sure we can capitalize on moves just like this one? Well, that s why you clicked this video right? Its actually pretty simple.
[02:44] So this is a pretty common chart setup. You will have equal highs right here. call these points support or resistance. But actually these points of liquidity.
[02:56] But before we get into the actual strategy. We first have to understand another core concept, which is fair value gaps. A fair value gap is simply when price moves up or down an insane amount,
[03:11] creating an imbalance in the market. You can mark this area by simply marking the wick before the big candle, to the wick after the big candle. This candle moved up so quickly that it didn t give sellers the chance to correct this move.
[03:27] Creating an imbalance in the market. So naturally price will want to come back its important for the strategy. So going back to the example before.
[03:39] Often times, if you go on a higher timeframe like the 1 hour or daily. There will usually be a bullish fair value gap right below this liquidity. Somewhere right here. And there will also be a bearish fair value gap above these highs somewhere right here.
[03:55] So going back to the point I made earlier. Price will naturally want to come down to this point to information we can work around. Price will naturally want to take Once it hits this fair value gap it will want to repeat the process.
[04:09] Well you may ask. Wheres the new liquidity? The liquidity is right here at these equal highs? So price will naturally want to take out this liquidity. And while doing that, price will usually move up so fast that it will leave another fair
[04:24] back down to this new fair value gap. Once price gets here it will naturally want to take out more liquidity. And where else to do that other than the highs, it made in the beginning? Price will naturally want to take out
[04:40] these highs. Creating liquidity. And then hit this bearish fair value gap. It will eventually hit this bearish fair value and then repeat this whole process to the downside.
[05:04] Once you start thinking of the market in the terms of liquidity and imbalances it will completely
[05:25] t even need to look exactly like this For example. Here we have this chart. We have Then on a higher timeframe we have a fair value gap right here.
[05:39] Price takes out this liquidity. Which gives it fuel to head downwards. While it comes down it leaves a small fvg. Price comes back up to it. Continues to fall. Now price breaks this liquidity. And we know it has an end goal of trying
[05:52] to get to this fvg on a higher timeframe. While doing this, it left a huge fair fvg to test it. Then reverses back down. So now we have 2 points of liquidity left
[06:05] and the market will continue to do this forever. One thing you should take from this video is price will always look for two things. Liquidity and imbalances. If you want price to go higher, you actually need price to go lower first.
[06:21] If you want price to go lower, you want price to go higher first. and share the monthly results every month so you can see how good the analysts are doing. And not to mention, people are absolutely loving the signals.
[06:34] Join the discord. I ll leave a link in the description.
⚡ Saved you 0h 06m reading this? Transcribe any YouTube video for free — no signup needed.



![BEST MACD Trading Strategy [86% Win Rate]](https://img.youtube.com/vi/rf_EQvubKlk/mqdefault.jpg)