

From $0 to $10K/Month Trading – The Truth
41sHigh income claims and rags-to-riches promise trigger curiosity and hope in viewers.
▶ Play Clip"Promises $10k from zero, but relies on funded accounts and capital scaling—misleading but offers a usable trading strategy."
This video presents a step-by-step trading strategy that uses order blocks and candlestick confirmation to achieve consistent profits. The creator claims that with a repeatable plan and access to larger capital through funded accounts, earning $10,000 per month is attainable even for beginners.
The trader states it took over three years to reach a daily income of $100,000–$200,000, attributing the difference to specific concepts they now use.
Stopping certain basic mistakes can lead to earning $10,000 in four months, even with little knowledge or experience.
The strategy is described as repetitive and easy to follow.
The video sets out to show if making $1,000 a month trading is possible and how.
A simulation of a full week of trading is used to evaluate the strategy's long-term effectiveness.
Order blocks, technical analysis via candlesticks, and time-of-day analysis are the three main tools.
The day is divided into sessions to identify periods of highest volatility.
An order block is the last opposing candle before a strong move; the first step is to locate it on the 1-hour chart.
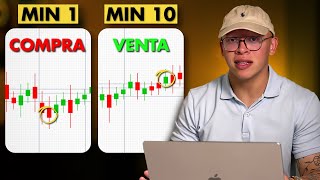
Once price reaches the hourly order block, switch to a 15-minute chart to look for slowing price action.
At the order block, price creates smaller candles, indicating a potential reversal.
After a strong move to the order block, wait for at least two weak (indecisive) candlesticks on the 15-minute chart.
Enter on the close of the second weak candle; place stop loss above the point of slowdown (above the order block).
Optimal entries occur at the beginning, middle, or end of the day, specifically around 2–3 AM, 10–12 noon, and 7–8 PM.
Set a fixed risk-reward ratio of 1:2, risking one unit to gain two.
Another day shows a breakout order block at midday with indecisive candles, confirming the pattern.
Over five days, the simulated strategy produced three winners and two losers.
Starting with a $200 account and risking 1% per trade, net profit over three wins and three losses was $6. This scales linearly with account size.
To reach $10,000/month, a capital of about $400,000 is needed. Funded accounts (e.g., Rocket 21) allow traders to access such capital without personal funds.
The common belief that a large personal capital is required to earn big money is false; funded accounts solve the capital issue.
The strategy should be practiced through backtesting and demo trading until it becomes automatic.
The video provides a structured trading plan that combines order blocks with candlestick confirmation and proper timing. It emphasizes that with a reliable strategy and access to substantial capital via funded accounts, earning $10,000 per month is achievable.
What is an order block in trading?
The last opposing candle before a strong move.
01:50
What is the risk-reward ratio used in this strategy?
1:2 (risk 1 to gain 2).
05:20
What are the three best times of day to trade according to the video?
2–3 AM, 10–12 noon, and 7–8 PM.
04:50
How many days out of five did the simulation win?
Three days.
10:06
What capital is needed to earn $10,000 per month according to the video?
Approximately $400,000.
11:55
How can traders access large capital without personal funds?
By using funded accounts like Rocket 21.
11:29
How many candlesticks are required on the 15-minute chart for confirmation?
Two weak (indecisive) candlesticks.
03:02
Where should the stop loss be placed?
Slightly above the order block.
03:28
What timeframe is used to identify the order block?
1-hour timeframe.
01:50
What timeframe is used to identify the entry confirmation?
15-minute timeframe.
02:05
Concise entry rules
Summarizes the entire entry process into four clear steps, making it easy to remember and apply.
03:43Funding accounts as capital solution
Introduces a practical way for traders with limited funds to access large trading capital.
11:29Winning 50% but net profitable
Demonstrates that a positive risk-reward ratio can make a strategy profitable even with a 50% win rate.
13:02Debunking the 'need big money to make big money' myth
Challenges a common belief and provides an alternative path using funded accounts.
12:47No movement is a coincidence
Highlights the importance of respecting price action patterns at key levels.
08:47[00:01] trading took me over three years, and today I typically generate between $100,000 and $ 200,000 per day. The difference between those two points is that I now use a concepts that help me earn more money every day trading.
[00:14] There are certain basic mistakes that, if you stop making them, earning $10,000 than four months. So, in this video, I'll explain how you can do it in the of knowledge or experience in trading. I know this is a big promise, but it's
[00:28] very easy to achieve if you follow this plan. The first thing you need is part that seems the most complicated, but at the same time, it's the easiest. I'm going to teach you a strategy that is literally repetitive, and you'll be able to
[00:41] follow it. Let's run the numbers and see if it's possible to make $1,000 a month trading. And how can it be done? Watch very a step-by-step guide to this strategy. Step by step, we'll explain what you need to do with timeframes, the rules, and
[00:54] strategy will consist of. We're going to analyze a full week to see if this is a good strategy or not, and what long run. First, we'll look at the results of this strategy for this
[01:08] simulating a full week of trading, and we'll see what the We're going to need several tools. The first tool we're going to use will be order blocks, and if you don't know how to use them, here's a video
[01:22] need to know to use order blocks correctly. That's going to be the combine this strategy with a little bit of technical analysis. We're going to observe the candlesticks and how they behave. And the third thing is that we're going to
[01:36] analyze the different times of the day. We're going to divide the day into different allow us to know when the moment of greatest volatility is. So let's begin. We're going to analyze this day completely. The first thing we're going to use is always, always, always...
[01:50] To be a word block, in this case I chose this part here. Look at this. Let's put it better. Now, this is the order block. It's the last opposing candle before the strong move, and today
[02:05] there was a discount towards the order block. So the first step is an order order block, either a breakout order block like the ones I've shown you in other videos, or a classic one like this. First step: order block. Second, when
[02:18] a smaller timeframe, in this case, 15 minutes. We're going to look for the we're going to switch to 15 minutes. When we find that it reaches that hourly order block, the second thing we're going to need is for the price to slow down because
[02:33] when it reaches the order block, it starts to create smaller candles, which gives us an indication that there's something happening at that specific point. And we're going to notice hourly timeframe, at that order, the price slows down, and you can see it in the candles.
[02:49] Notice that it arrives strong, then creates a small candle, another one. Small and then second confirmation is that once it reaches the order block, using technical analysis we will analyze the candlesticks and see if the candlesticks slow down
[03:02] once it reaches the order block. Once we see that reduction in speed in the candlesticks, we need to confirm it with a minimum of two candlesticks that reach the order block strongly, that the next two candlesticks in 15 minutes of the
[03:14] order block are weak candlesticks like this one and like this one, and immediately close the second candlestick. I put the entry here to make it a little more realistic. But when the second candlestick closes, I would take my sell entry and I would put
[03:28] my stop loss above that point where the price slowed down, which would be specifically this point, just a little above, only to as a basic rule, once I put that entry above, I observe that the stop loss is
[03:43] ideal because the lord block is a point of push for the price, which makes the price move, to put it simply, and if above the lord block, it means that the lord block is not It's working. So,
[03:58] step one, we're going to look for an order block on the 1-hour timeframe. In step two, we're going to go to the 15- minute timeframe. Once we reach that 1-hour order block, we're going to wait for the next two candles to be slow candles. In
[04:10] step three, we're going to take the entry once the second candle closes. Then, as step four, which is the timing and schedule part, we're going to focus on the following: I have the theory, and I've been able to analyze, that in each session and on
[04:24] each day, we have three best entries. It will always be at the beginning, near the middle, or near the end. These purple lines that we have here represent the division of a day. Between this purple line, there is
[04:38] one day; between the other purple line, there is one day. This here is one day; this is another day; this is another day. These purple lines simply divide the days. On this day, or on any of the other days, the best entries will
[04:50] be at the beginning of the day, in the middle of the day, or at the end of the day. So, we're going following this repetitive strategy, is at the beginning of the day, at the end of the day, or in the middle of the day. Generally, the best times to start the day would be between 2 and 3 in the
[05:05] morning, midday between 10 and 12 noon approximately, and the end of the day between 7 and 8 at night. These would be the best times to wait for these types of movements. And finally, once we
[05:20] have everything defined, we're going to set our risk-reward ratio of one to two. These will only be one-to-two entries, no problem. I'm best take profit. I'm only going to set one-to-two entries. In this case, entering
[05:36] here, stop loss here, and the take profit two would be risking one to gain two. All entries would be the same, so remember the steps: I look for an order block on the hourly or 15-minute timeframe. I look for two candles that
[05:49] are slower than the ones that reach the order block. Then I take the entry at the close of the second candle. I place my stop loss above the order block. I look for the entry to be at the beginning, middle, or end of the day. And finally, I set
[06:02] a take profit of one to two. If you copy these rules and literally follow them to the letter From the chart, you'll see how this repeats itself many days. Let's continue analyzing. Let's look at the previous day, simulating another
[06:15] look at the previous day, simulating another day. Let's see, this day would be the day before that one. Let's see the same thing. Here we have an order block, in this case specifically a breakout order block. We observe that the price reaches
[06:28] the order block, and notice the timing. It's exactly what we're exactly what we're talking about, right in the middle of the day. We see it here. Notice that right in the middle of the day, that order block arrives. And
[06:41] when it reaches the order block, we see one or two candles. What I want you to notice is the following: once it arrives, the way it causes that rejection is like with indecisive candles. And notice how the candles are:
[06:56] candle that dropped sharply, the same size. Those are indecisive candles. Another type of indecisive candle we can find are these with low volume. despite having a little more volume than the previous ones, the
[07:12] volume represents that it went up sharply and dropped sharply. So they are also indecisive candles. Indecision, and once I reach that order block, what do I do? I take my entry at the close of the second candle, I place my stop loss above the order block. In
[07:26] this case, I think we can position it a little better, like around this area, and I place my entry approximately one to two, it would be around here, one to two, always one to two entries. That's the average, the risk-reward range we'll be
[07:39] looking for in the one to two entries, always stop loss up here, and take profit down here. Once we find that, let's look at the timeframe, and it would be about halfway. If we visually look at the space
[07:53] to the right, we're more or less right in the middle of the day, so it's a good area to enter, a good timeframe. Let's also look at the previous day and see how it goes. And let's see if we find the following: we're now
[08:08] analyzing the whole week. We've seen that we have two days where we had approximately one to two trades. Here we see another order block, the last one, the opposite, larger, a strong movement, and here's the perfect order block.
[08:21] When I reach the order block, I go to the smallest timeframe, in this case, 15 minutes, and I look for candles of Indecision. And notice that when it reached the order block, it arrived with a slightly weak candle, then it started and created a
[08:35] following candles were also indecisive. I took my stop loss entry above the order block, the take profit one to two, and that's it. Notice how perfect that is. That's why I
[08:47] tell you that no movement is a coincidence because before the day closed, this was surely caused by some economic event or something like that. But before the day closed, we see how that little wick arrives. Uh pup,
[09:00] perfect, towards the low. It would basically be a wick that only triggered the take profit, and then it returned and didn't go back to the zone all day. It returned to the zone the next day, and here we observe that it meets all the
[09:12] parameters, and we are close to the beginning of the day. This was the beginning. Other days we see the middle; rarely are they seen at the end of the day. Generally, it will be between the beginning and the middle, according to my experience, working with that
[09:25] concept, but that way it works better at the beginning and middle. At the end entries, so if you If you have space to trade in the morning, that would be advisable, or in the early morning ( New York time), or in the middle of the
[09:39] day. So, once we've set our risk/reward ratio, knowing that at the our confirmations, everything is ready to take the entry, and very importantly, the stop loss above the order block is
[09:52] ready. Now we have three entries. If we analyze the previous days—that's why, if you noticed, the previous days I had an x here, an x here, an x—it's because there were no entry confirmations for those days.
[10:06] So, to simulate it in a better way and make it as realistic as possible, this day we lost again. We only won three days out of the five days using that repetitive strategy. In a whole week, we only won three and
[10:21] lost two. And even to be even more realistic, let's say that last week we lost one, and that we lost three and won three. Perfect. Now let's do a small calculation and see how this would work to go to
[10:36] part two of how to make these $10,000 by trading. Let's suppose you by trading. Let's suppose you have an account of $200, and with that $200, which was all the money you had, you used this strategy.
[10:48] You lost three and won three. You risked 1% of the account using that strategy. Your first trade, which was 1%, lost $2, the second $2, and the third was $2. You lost $6, but then with the other three trades that
[11:03] you won, you won $4 because you're risking two to win four. In the other four, that's $2. Compared to a loss of $6, if we do the total, that would be a total of $6. You only won $6 between those
[11:17] trades. That's not even close to $ 10,000. But with this, I just want to debunk a myth, which is that many people think that with $200 it would be almost trading. Everything I've done, I've done from
[11:29] funding accounts. These are accounts provided by companies that give you a test, and if you have the ability to trade well, have good analysis, a good strategy, and you pass that test, they'll give you capital. So, if you have an
[11:41] account of $200 You were able to make $6 means that with a $2,000 account you could make 60, with a $20,000 account you could make 600, with $200,000 you could make 6,000, and with $0 you could make 12,000. So, how do you make $
[11:55] 10,000? We already know you need an average of $0 to trade. You do n't have $400,000. So what do you do? You take the exact same numbers funding accounts come in. You can take two $200,000 exams, combine the
[12:10] accounts, and do the exact same process. The strategy didn't change; nothing changed. The only thing that changed was the capital. The success rate stayed the same, the strategy stayed the same, the schedule stayed the same, the rules
[12:22] stayed the same—everything stayed the same. The only thing you need to make $1,000 a month trading, or $100,000, or a million, or whatever you put in... Your mind is capital. We, who are mostly from Latin America and have limited
[12:34] resources, can't invest $200,000, $ 400,000, or even a million dollars funding companies are the best solution when we're looking for Rocket 21 for the last two years, and it's the
[12:47] look, we've just debunked the myth that you need a lot of money to make need thousands of dollars to get that high capital. Second, you repeatable strategy. So what do you
[13:02] month trading? It's a risk-reward strategy, which is what I just explained to you. Look, you only won 50% of the time with the strategy I taught you. You lost 3 days, won 3 days, but even so, with a
[13:14] good risk-reward ratio, you finished the set of trades in the black. same strategy, but now in your personal account. By analyzing all the steps from one to six, you'll find those entry points and you'll see that the only thing
[13:27] preventing you from reaching $1,000 a month is capital. And it turns out that's the strategy is difficult to develop, and I've already given it to you. The mindset and the are also difficult to develop, and I've already given them to you. Now, all you need is capital,
[13:41] and the myth that you need a lot of money to earn a lot of money is debunked. You don't need a repetitive strategy; you need to use a funding account, and you the probabilities time and space to do their work. The next
[13:55] step is for you to use that strategy and start practicing it. Practice it on your practice it even by backtesting, because once that strategy becomes time you see the same pattern, you'll be able to execute it correctly. And now, if you
[14:09] executed it correctly with a $2, $200, or $100 account—it doesn't matter—you'll have to with higher capital. But remember, there's a mental limit that you... It makes you math, but it's just a matter of percentages. The percentage will vary
[14:24] depending on your capital, but nothing changes; the strategy is exactly the same, and you can make $10,000 a month trading with this plan. If you follow this plan exactly as I just explained it, making $10,000 a month
[14:36] trading will be super easy. And with nothing more to say, see you in the next video. Bye bye and kisses. Enjoy this strategy!



⚡ Saved you 0h 14m reading this? Transcribe any YouTube video for free — no signup needed.