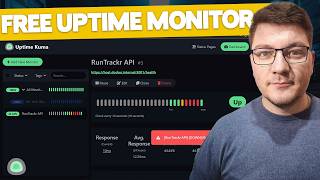

Free Self-Hosted Monitoring Tool
45sHigh curiosity about a free, open-source alternative to paid monitoring tools.
▶ Play Clip"Delivers exactly what the title promises—a clear, practical walkthrough of monitoring a .NET API with Uptime Kuma."
This video demonstrates how to set up Uptime Kuma, a self-hosted, open-source monitoring tool, and use it to monitor a .NET application's health endpoint. The presenter walks through Docker installation, creating monitors, configuring status pages, and handling notifications.
Uptime Kuma is a self-hosted, open-source monitoring tool with over 80,000 GitHub stars, free to use.
Run with Docker: `docker run -d --restart unless-stopped -p 7001:3001 --name uptime-kuma louislam/uptime-kuma:1`.
First-run setup: choose embedded MariaDB, create admin account, then land on dashboard.
Monitor types include HTTP/HTTPS, TCP, DNS, Docker containers, and pre-configured for Kafka, RabbitMQ, SQL Server, Postgres, Redis.
Configurable: heartbeat interval, retries, HTTP method, request body/headers, auth, and notifications (Slack, Telegram, WhatsApp, email, PagerDuty).
Create status pages, post incidents, and schedule maintenance windows.
Group monitors into umbrella groups for overall health view.
Monitor .NET API health endpoint at `http://host.docker.internal:5001/health`; use host.docker.internal because container is isolated.
Stopping Redis causes health endpoint to fail, and Uptime Kuma flags service as unavailable after retries.
What is Uptime Kuma?
Uptime Kuma is a self-hosted, open-source monitoring tool with over 80,000 GitHub stars.
00:17
What Docker command starts Uptime Kuma?
docker run -d --restart unless-stopped -p 7001:3001 --name uptime-kuma louislam/uptime-kuma:1
01:30
What port mapping is used for Uptime Kuma?
Port 7001 on the host, port 3001 inside the container.
01:45
Which database does the author choose for Uptime Kuma?
The embedded MariaDB instance.
02:39
What monitor types does Uptime Kuma support?
HTTP/HTTPS, TCP port, DNS, Docker containers, and pre-configured types for Kafka, RabbitMQ, SQL Server, MongoDB, Postgres, Redis.
03:20
Name three notification integrations mentioned.
Signal, Slack, Telegram, WhatsApp, SMS, email via SMTP, Resend, SendGrid, and PagerDuty.
04:30
What hostname is used to access a local .NET API from inside the Uptime Kuma container?
host.docker.internal
07:48
Why is host.docker.internal needed instead of localhost?
Because the container runs in an isolated network and can't resolve localhost to the host machine.
08:03
Uptime Kuma's popularity
Over 80,000 GitHub stars signal a trusted, widely adopted open-source tool.
00:17Using host.docker.internal
Key networking trick to reach host services from a Docker container.
07:48Health endpoint reflects dependencies
Shows how a health check can aggregate the status of underlying services like Redis.
09:12Status pages and incidents
Demonstrates how to communicate downtime to users effectively.
05:40[00:02] status of your websites, APIs, and services? In this video, I'm going to show you a really cool self-hosted monitoring solution. It's called Uptime Kuma, and I'm going to walk you through setting it up and connecting it to your
[00:17] .NET application. Here's the Uptime Kuma GitHub repository. You can see it has more than 80,000 stars, so it's definitely a very popular monitoring tool. It's also open source and free to use. And just a glimpse of what the UI
[00:32] looks like. It reminds me a bit of Uptime Robot, which is another tool that I'm using for monitoring my services, and I really like it, which is why I'm also exploring Uptime Kuma as a free alternative. I'm going to leave the link
[00:45] to the self-hosted instance of the status dashboard for my website, if you Uptime Kuma looks like. And now, let me show you how we can get started with first, we are going to need some sort of application to monitor. And I'm going to
[01:01] use my Run Tracker application, which comes with a .NET API, a Postgres instance, a Seq instance, a Redis instance, and a local emulator for blob storage. Now, Uptime Kuma gives us the option to monitor all of these services
[01:15] individually, or we could use the health check endpoint that we expose from our .NET API, and then use that to derive the health of the system. So, how do we get started with Uptime Kuma? I'll open up my terminal, and I'm going to say
[01:30] docker run, because I want to run this inside of a docker container. I'll run this in detached mode, and we're going to say that it should always restart until it eventually succeeds. When it comes to port mappings, I'm going to map
[01:45] the port 7001 locally, and internally Uptime Kuma uses port 3001. This is also a port I commonly use for my local applications, so I just want to avoid any conflicts. I'll give my container a name. Let's call it just Uptime Kuma.
[02:00] And then I just need to specify the name of the image, which is And then the of the image, which is And then the version this. And if you don't have this image locally, you're going to see that Docker
[02:14] will start downloading it for you. And eventually, it's going to start, which we can confirm from Docker Desktop. And you can see my Uptime Kuma instance is up and running. If I go into the logs, I can also confirm that it's available.
[02:27] And I will be able to access this on localhost:7001. And here's what I see when I open the Uptime Kuma UI. And the first thing database we want to use with this
[02:39] service. I'm going to go for the embedded MariaDB instance. And I'll click next. And this is going to take a couple of moments when you first run it to provision everything it needs in the database before you can use Uptime Kuma.
[02:51] After a minute or two, you're going to be prompted to create your admin account. And I'm going to fill in the admin username and password. And then I will click create. And we're going to land on the Uptime Kuma dashboard. So,
[03:04] from here, you can finally start using this monitoring tool to set up some add new monitor. And the first thing you have to choose is which type of monitor website or a health check endpoint, using the HTTP monitor type is the
[03:20] correct choice. You could also monitor a TCP port, DNS, Docker containers. And then there are some preconfigured monitor types for commonly used services like Kafka, RabbitMQ. And of course, there are monitor types for popular
[03:34] databases such as SQL Server, MongoDB, Postgres, Redis, and so on. So, let's keep it simple. I'm going to use an HTTPS monitor. And we're going to start by creating a simple monitor for my website. I'll specify a friendly name,
[03:47] website. I'll specify a friendly name, drop in the URL to my website. And let's reduce the heartbeat interval to 10 seconds just so that we get some more action on the UI. Now, from here you also have a lot of different options.
[04:00] For example, you can choose how many unsuccessful attempts is required before default, this is zero, but you can increase it if you want to. You can also choose which HTTP method is used to send a monitoring request. You can also
[04:15] include an optional request body or request headers, also authentication credentials if that's required. And another thing that you can configure is notifications for when your service is down. And they have quite a bit of
[04:30] notification types built in depending on what you want to use. There are integrations for, for example, Signal, Slack, Telegram, WhatsApp. There's support for SMS, email over SMTP, Resend, or SendGrid. It also integrates
[04:44] PagerDuty. So, there are quite a few options here. Now, I won't be demoing this as part of this video, but overall, you just set up your notifications and notified over the channel that you configured. So, let's create our monitor
[05:00] and right away it's going to send a request and if it succeeds, we're going to get a green uptime tick here. Now, every 10 seconds another request will be sent and this is going to keep increasing as long as your service is up
[05:13] and responsive. You can also get some metrics here for the request response time, the average response time, your uptime over the last 24 hours and 30 days and last year. And you also get info on when the certificate expires and
[05:27] when the domain expires, which is also a good reminder for me to go and renew my domain before I run into any problems. And then a nice graph here for the average ping to the website that we are currently monitoring. Now, what else can
[05:40] we do from here? After we created our monitor, we can create a status page. So, I can go ahead and give my status page a name. I can also give it a custom URL slug if I want to. And then, once I create my status page, I need to add a
[05:54] monitor that's going to be included as part of the status. So, once we've done this, we can click save, and here is our live status page showing the uptime of the services that we are monitoring. I can also edit this by, for example,
[06:08] creating an incident. Let's say the style is danger, and let's say we've got some problem that we are looking into. So, I can post this, and now if I refresh my status page, we can see an incident report. Another thing we can do
[06:23] here is schedule our maintenance by clicking our profile, then maintenance, maintenance. You fill in some basic details, choose which monitors and status pages are affected, and then you can choose the date and time for when
[06:37] this maintenance should be active. So, I'll click save, and if I go to my status page, I can now see that there is some schedule maintenance, and it has an should be back in operational. So, these are the interesting parts. You set up
[06:51] your monitor, or multiple of them. You can even group them. I'll say edit here, and then go down to find the groups. Here it is. I can click the plus button create an umbrella group called all monitors, and I can now include it
[07:06] inside of my website. This is going to slightly update the UI to show you the status of the entire group overall, as well as any individual monitors that you have inside. Now, let's create a new monitor, and I want to start monitoring
[07:20] my locally running .NET API. If I send a get request to localhost:5001/health, here's the response that we get back. You can see the status of our API is healthy. Of course, the API has to be running in the background. It also
[07:34] contains any health checks that I have configured, like for MPGC SQL, which is a check for my Postgres database, and also for Redis. So, now I want to use this to add a new monitor and I can still use HTTP or HTTPS and I'll give
[07:48] this a friendly name. Let's call it the run tracker API and for the URL, I'm going to specify host docker internal, the port is 5001 and then {slash} health. I'm doing this because I'm running my Uptime Kuma instance within a
[08:03] docker container, which means it's going to run in an isolated network. However, by default, it's going to run in bridge mode and because of this, I won't be able to access any localhost instances because it's going to attempt to resolve
[08:16] them within the container network and it's not going to find anything. So, if I specify host docker internal, it's going to know to resolve this to the docker container running my API instance and then everything should work
[08:28] heartbeat interval, let's say 10 seconds, but let's say it takes one retry before we mark our service as failing. And because I'm using a self-signed certificate, I'm going to say ignore TLS SSL errors for HTTPS
[08:43] websites. So, let's go ahead and click save. I'll confirm this and we've got our monitor instance up and running. So, you can see our monitor is up or now. Any moment now another request should appear and then every 10 seconds we're
[08:58] going to get another tick here. Now, if I open up docker desktop and I stop some service that our health endpoint is dependent on, for example, Redis, then this is going to change the state of our health status endpoint and we should see
[09:12] this reflected inside of Uptime Kuma. Now, remember that we also have a retry, so it might take a moment for the API to go down, but you can see that we've got one failed request here, which is why it says pending and then it's going to just
[09:24] flag our service as unavailable because the health status keeps returning a failing health check. If I go back here and just rerun Redis, it's going to pick up on this as the health status endpoint will return 200 okay and this should be
[09:38] reflected inside of Uptime Kuma on the subsequent API request. So, now we can do is wire up some notification mechanism and we'll get notified anytime our service goes down and then we can figure out how we're going to solve the
[09:52] operational. If you're getting into self-hosting, this is a perfect monitoring tool to get started and if you want to see my self-hosting setup, then go ahead and check out this video next. If you enjoyed this video, I ask
[10:06] you to just gently tap the like button below the video. Thanks a lot for watching and until next time, stay awesome.


⚡ Saved you 0h 10m reading this? Transcribe any YouTube video for free — no signup needed.