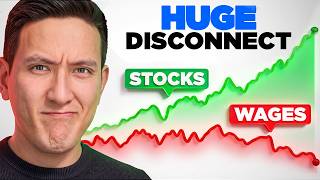

Record Highs & Paycheck to Paycheck
45sImmediately juxtaposes two contradictory headlines, sparking curiosity and relatability.
▶ Play Clip"Delivers a solid, data-backed explanation of the paradox, though it's more of an economic analysis than a personal finance guide."
The video explains the apparent paradox of record-high stock markets while many Americans struggle financially. It debunks the myth that the stock market equals the economy, highlighting that the S&P 500 is heavily concentrated in a few AI-driven tech giants. The video also discusses the K-shaped (and emerging E-shaped) economy, where the top earners capture most gains, and offers practical advice for individual investors.
CNBC headlines show S&P 500 and Nasdaq at record highs while more people live paycheck to paycheck. Both are true, and the video explains why.
The stock market measures expected future profits of the top 500 corporations, not the overall economy. It doesn't reflect prices of eggs, rent, wages, or job availability.
The Consumer Sentiment Index hit a record low, lower than during COVID and 2008. 57% cite high prices eroding finances; supply disruptions in Strait of Hormuz push gas prices up.
Fed projects 2.2% GDP growth, hiring slowest in a decade (ex-pandemic). S&P 500 earnings expected to grow 17-24% this year; 84% beat estimates in Q1 2026.
Top 10 stocks make up ~40% of S&P 500, highest ever. Nvidia and Apple each 7% (14% combined). At dot-com peak, top 10 were 26%.
Nine of top 10 companies are AI/tech related. CapEx (capital expenditures) on data centers, chips, etc., at record levels. Five companies expected to spend $800B-$1T on CapEx this year.
AI-related CapEx responsible for ~75% of US economic growth in Q1. Without it, growth would be ~0.5%. GDP now measures data center spending, not broad economic health.
Hiring down, entry-level hiring down 6% YoY. Companies shift budgets from headcount to AI, frustrating college grads.
Top 1% own 50% of stocks ($27.6T); top 10% own 87%. Bottom 50% own only 1%. Median family holds $52k in stocks; 10% market gain = $5,200 for them vs $2.7T for top 1%.
Median family wealth is in home (illiquid). Top 1% have liquid brokerage accounts, so market gains are quickly realized and spent.
Top 20% (earning ~$175k) account for ~60% of consumer spending. Their spending grew 6.5% YoY; bottom 80% grew 2.6% (losing to inflation).
Real average hourly earnings fell 0.3% while CPI rises. Gas up to $4.12 (from $3.14). Savings rate under 3%. Household and auto debt delinquencies at record highs. Ages 18-29 hit hardest.
Some economists propose E-shape: top pulls away, bottom falls behind, middle treads water. Middle class is one bad quarter from cutting spending, removing stabilizer.
1) Economy centered on one trade (AI capex). 2) Capex math must work: gap between AI spending and revenue is 46% (dot-com peak 32%). 3) Fed could raise rates (75% odds of hike by December).
Wealth is tied to ownership. To be in top 50/20/10%, you must own assets. Open a Roth IRA (10 minutes), invest in index funds (low cost).
1) Focus on what you control (spending vs income). 2) Own boring index funds (top 10 change over time). 3) Build an emergency fund before investing (national savings rate under 3%).
The stock market's record highs are driven by a few AI giants, not broad economic health. The economy is increasingly K-shaped (or E-shaped), with top earners capturing most gains. To benefit, individuals must own assets, invest in index funds, and build a safety buffer.
What does the stock market actually measure?
Expected future profits of the top 500 largest corporations in the US.
00:43
What percentage of the S&P 500 do the top 10 stocks make up?
Close to 40%.
02:27
What is CapEx?
Money a business spends to acquire, upgrade, or maintain long-term physical assets like property, buildings, equipment, or technology.
03:36
How much are a handful of companies expected to spend on CapEx this year?
Roughly $800 billion to $1 trillion.
04:04
What share of US economic growth was AI-related CapEx responsible for in Q1?
Roughly three quarters (75%).
05:14
What percentage of stocks do the top 1% of Americans own?
50% (about $27.6 trillion).
06:38
What percentage of stocks do the bottom 50% of Americans own?
1%.
07:08
What is the median family's stock holdings?
About $52,000, including retirement accounts.
07:21
What is the K-shaped economy?
A situation where high earners' purchasing power rises while low earners' falls, widening the gap.
08:54
What percentage of consumer spending do the top 20% of households account for?
Nearly 60%.
09:19
What is the E-shaped economy?
A proposed shape where the top pulls away, bottom falls behind, and the middle treads water, adding a middle prong to the K-shape.
11:23
What is the gap between AI capital spending and AI revenue according to Alliance Research?
Around 46%.
12:57
Stock Market ≠ Economy
Debunks a common myth, setting the foundation for the entire video.
00:29Top 10 Stocks Concentration
Reveals the extreme concentration in the S&P 500, explaining why record highs may be misleading.
02:27AI Spending Inflates GDP
Shows how AI CapEx is artificially boosting GDP, a critical insight for interpreting economic data.
05:14Wealth Inequality in Stocks
Quantifies the stark inequality in stock ownership, highlighting who really benefits from market gains.
06:38E-Shaped Economy
Introduces a new economic model that better captures the middle class's precarious position.
11:23Ownership is Key
Provides a practical takeaway: wealth is tied to ownership, and individuals should invest to participate.
13:50[00:02] recently came across. So, number one from CNBC, quote, "The S&P 500 and Nasdaq close at new records lifted by the tech rally." And number two, "More living paycheck to paycheck." What's crazy is that both of these headlines
[00:15] are true. Neither one of them is a lie. There are actual reasons as to why they by the end of this video, you'll know exactly why this is happening and what Now, I want to start this video off right away debunking a very common myth
[00:29] you might see online. And that myth is that the stock market is equal to the economy, but this, in fact, is not true. Because the question people usually ask when everyone is struggling? This question inherently assumes that the
[00:43] stock market measures the economy. The reality is that the stock market has will use these terms interchangeably, but that is incorrect because the stock market only measures what expected future profits of corporations are. If
[00:56] we're really only looking at the expected future profits of the top 500 largest corporations in the United States, and that's honestly it. So, market doesn't measure then. It doesn't measure the price of eggs, the price of
[01:10] rent in your local area, your wages, and how hard it is to find a job. The Sentiment Index, which has been tracking consumer sentiment for the past 75 years, just hit a record low. This
[01:22] measures Americans' confidence in the overall health of the economy and is a leading indicator of GDP growth because consumer spending accounts for about 2/3 of US GDP. As to why it's hitting that record low, the survey
[01:34] summarizes that, quote, "57% of respondents cited high prices as eroding their finances up from 50% the prior month, and supply disruptions in the Strait of Hormuz are pushing gasoline prices higher, and that single line item
[01:48] household mood." Essentially, cost of living is squeezing the average hits a record low, which, by the way, is lower than when it was during COVID and the 2008 financial crisis, this is the time to pay attention. The Fed projects
[02:02] around a 2.2% GDP growth this year and hiring is at its slowest pace in over a decade outside of the pandemic. The stock market, on the other hand, has been growing very steadily over the past few years and it's expected that the S&P
[02:15] 500 earnings will grow somewhere between 17 to 24% this year. In Q1 of 2026, 84% their earnings estimates, which is the highest rate since 2021. So, the economy
[02:27] and the stock market could not be more disconnected as of right now, but here's what you should really know about the S&P 500. The top 10 stocks make up close to 40% of the entire index now. Since this is the highest concentration ever
[02:40] attention to. So, at the height of the dot-com bubble back in 2000, the top 10 companies made up about 26% of the S&P 500 and today, well, I just shared with you, it's about 40%. Nvidia and Apple both make up 7% of the index for a total
[02:55] of 14% between just two companies. So, when you hear that the headlines of the S&P 500 just hit a record high, what you should actually think about or interpret is that a handful of AI companies are having a good day when that happens. And
[03:08] mislead you to believe that the entire stock market is ripping overall, when in fact, the other 490 stocks could be having a completely mediocre year and as long as the top names keep ripping, the headline is still going to read record
[03:22] in my head after learning this is, what is actually driving these 10 companies, the top 10, to the proverbial moon? Now, the answer might be obvious to you or it but if you look at the top 10 companies, most of them, I would say nine out of 10
[03:36] have something to do with AI or technology. And that's where capital expenditures come into play. So, CapEx, as it's known for short, is the money that a business will spend to acquire, upgrade, or maintain long-term physical
[03:49] assets, such as property, buildings, equipment, or technology. That's the expenditures for most corporations, especially the big hyper-scaling corporations like Amazon, Microsoft, Alphabet, Meta, and Oracle, they are all
[04:04] at record numbers. This year, a handful of companies are expected to spend roughly 800 billion, even upwards to 1 trillion dollars on CapEx alone. So, things like data infrastructure, data centers, chips, power infrastructure,
[04:19] and memory. To put 800 billion dollars in perspective, the entire GDP of Sweden is around 760 billion. So, five companies are spending more than the entire country of Sweden on mostly buildings filled with Nvidia chips. And
[04:32] not often talked about, which is that we all know that we're spending a lot of money on AI infrastructure in the United States, but the scale at which we're spending is literally crazy. It's like if you were a citizen of Sweden and all
[04:45] and said, "You know what? Instead of everything that you're spending money on in Sweden, for example, your food, your transportation, or your discretionary years, we're just going to spend all of that money on AI." Now, here's where
[04:58] I have to correct something that I just implied a few minutes ago, which was economy are disconnected. And this is pretty true, but AI spending is so huge these days that it's actually showing up in GDP numbers. Analysts who broke down
[05:14] the Bureau of Economic Analysis's Q1 GDP data, they estimate that AI-related CapEx was responsible for roughly three quarters of all US economic growth. If growth would have been roughly half a percent, which is, I guess, technically
[05:28] still growing, but it's closer to flat. So, when a data center gets built, GDP that it would count your raise at your job. And that's a scary statistic because we can't really look at GDP anymore the same way. This is also why
[05:42] stagnant when the news says that it's growing, and you're not actually wrong paychecks are coming in, but the GDP number is actually measuring the data center spending itself. And this same inflation in the GDP that's happening is
[05:56] actually stagnating the job market because hiring is way down this year budget away from head count and towards AI. You can see this frustration among college grads who are now increasingly more irritated by AI because entry-level
[06:10] hiring is down 6% year-over-year. So, there is actual proof that even incentive to bring on entry-level workers when they can have AI do the job of what's going on in the United States right now, we now have to think with all
[06:25] of this spending and growth of corporate profits, who are the actual winners of this game? Who's keeping the gains here? Because if gains were spread evenly in the stock market would be great news for everyone and this video would
[06:38] probably not exist. But, as you can deduce, this is not actually the case. evenly. The top 1% of Americans by wealth, they own 50% of all stocks and that's about 27.6 trillion dollars per the most recent Federal Reserve data.
[06:54] The top 10% of Americans hold more than 87%, so that means the bottom 90% in this country or nine out of 10 people, they will split the remaining 13% of the stock market. And the most alarming statistic here is that the bottom 50% of
[07:08] Americans, they only own 1% of the stock market. While you will see figures of many Americans owning stocks in general, 58% of Americans own stock, that is technically true, but they simply just don't own enough stock. The median
[07:21] family that owns stock holds about $52,000 worth. That's it and that includes retirement account balances. So, if the market goes up 10%, which is roughly what the S&P 500 has produced so far this year, the median family might
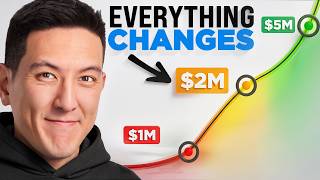
[07:34] see an increase in their wealth of $5,200, which is 10% of 52,000 and it's probably going to be in a 401k. Meanwhile, that same 10% return for the top 1% of Americans represents $2.7 trillion in total wealth. So, while we
[07:48] are going to produce very different realities depending on who you are. And every few weeks and it still feels irrelevant to how you are personally doing at home. The median family in America, their wealth isn't actually
[08:02] held in stocks. It's mostly in the home that they own and that comprises the majority of their net worth. A house is not very liquid and does not appreciate sitting in your house right now and you want to sell it tomorrow, it's likely
[08:15] your house tomorrow. It's not very liquid. You still have to list it with a inspections, you have to agree to purchasing terms, then the money has to go into escrow, etc., etc. All this stuff probably takes you at least 30 to
[08:28] 60 days at the fastest and more often than not you will be tied to your home for a very long time so long as you have a mortgage on it. The top 1% on the other hand, a home might just be a small percentage of their portfolio and when
[08:40] brokerage account or in your stock accounts, record highs in the market are going to be felt much more quickly and realized for various activities something we need to talk about, which is that the gains sitting in the top 10%
[08:54] of American brokerages, they will get spent and that spending can literally hold up our economy. Economists will call this the K-shaped economy and you can see with this graphic that purchasing power is going to be on the Y
[09:06] axis here and for high earners, their purchasing power is going up and to the and to the right. In other words, the gap between low and high earners is widening and Mark Zandi, the chief economist at Moody's Analytics, has
[09:19] households, which means that they earn around $175,000 per year, they now account for nearly 60% of all consumer spending and he himself calls that statistic astounding. And you can see the two lines are moving in opposite
[09:33] directions. And here's another interesting stat, the top 20% their spending grew 6.5% year over year, which is comfortably beating inflation. The bottom 80% their spending grew 2.6% losing to inflation, which basically
[09:47] means in real terms that the bottom 80% in this country is spending flat to negative year over year. So, the entire growth in the American consumption or American consumer is at the top. The typical top 10% American has had their
[10:00] brokerage account balance go from 624k at the end of 2022 to over 1.1 million dollars as of late 2025. So, in a span of 3 years a top 10% American might have an extra 500k sitting in their brokerage accounts and this is leading to them
[10:15] going on vacation more, buying new cars, and not even checking the prices of groceries. In other words, this is causing the disconnection of our society about the data at the bottom of the K because this is where the data really
[10:28] reflects the current vibe in the economy. First, real average hourly earnings fell 0.3% over the past year while CPI is still increasing. So, in other words, people are earning less but prices are still going up. Second, gas
[10:42] from the Iran crisis is now up to $4.12 in June, which is up from $3.14 a year ago. Third, personal savings rates are down. I believe it's under 3% now. And fourth and fifth are the fact that the total household and auto debts, they're
[10:56] delinquencies are the highest ever recorded. Also, if you're young or just like the economy is rigged against you specifically, the data says that ages 18 to 29 absorb the strain worse than anyone else. So, for example, in terms
[11:11] of delinquencies, it's roughly double a year ago for this age group, which is the worst of all the age groups. So, this is actually pointing to some economists wanting to rename the K-shaped economy to an E-shaped economy,
[11:23] which is a brand new shape. The E-shape refers to three prongs. The top continues to pull away, same as in the K-shaped economy. The bottom visibly falls behind here as well, but the middle prong is new. According to this
[11:36] among middle-class Americans is where you start to see some signs of the spending on their necessities and some discretionary categories, but the middle class is treading water so they can still pay their bills," she says. And
[11:50] here's why this E matters more than the K. So, in the K-shaped economy, the middle class is the stabilizer. The top can splurge, the bottom can struggle, steady. And this steadiness of spending ensures that the entire economy won't
[12:03] topple over overnight. Historically, steady middle-class spending is what kept downturns from spiraling out of control. But in the E-shaped economy, which means that they are one bad quarter away from cutting spending even
[12:16] majority of consumer spending is reliant on the top 20% and they're spending portfolios have increased a lot in the past 3 years. So, there's a lot of risks section, the three biggest risks to the economy right now. And the first is that
[12:31] the economy is slowly being centered to one trade and the spending is being powered by stock gains and those stock gains are being powered by AI companies, then the entire economy is coming down to AI capex spending. If wealthy
[12:44] rest of American households might not be able to help keep those numbers steady. Risk number two is that the capex math actually has to work. So, Alliance Research found that the gap between AI capital spending and actual AI revenue
[12:57] is around 46%. That means the spending isn't scaling the underlying revenue at exactly the same pace quite yet. During the dot-com bubble, the same gap peaked at around 32%. So, if revenue doesn't show up as quickly as the AI companies
[13:11] issue down the line. And risk number three is that the Federal Reserve could still raise rates this year. So, as of July, the market is pricing in roughly a 75% odds that there's going to be one more hike by December. I'm not here to
[13:24] genuinely don't know and no one out there knows either. I know this video has had a lot of doom and gloom so far, structure of the current market is heavily concentrated around the gains
[13:37] spending doesn't amount to real revenue, that could mean we could see a significant pullback in the market, which could in turn affect the GDP question that actually matters now, which is what do we do with all of this
[13:50] information? The takeaway I have for you is that everything that we've talked about in this video so far, including the fact that the top 20% of Americans spend the most or the K-shaped economy or the fact that a 10% gain in the
[14:02] market represents $2.7 trillion of wealth, it all runs on one single idea, which is that wealth is basically tied to ownership. In today's world, you must have ownership of something in order to get yourself into the top 50 or the top
[14:15] 20 or the top 10% of the country. The economy works by transferring wealth which are impacting the market, and so what I want you to take away is that you soon as you can. A Roth IRA, for example, that takes 10 minutes to open.
[14:30] Index funds cost essentially nothing to own on a yearly basis, and there is no like stocks are being kept behind some sort of password-protected gate, either. You can easily access them through any brokerage app as long as you have the
[14:43] willingness to do so. So, the play is exactly what I've shared on this channel before, which is that first, you can only focus on what you can control. difference between what you spend and what you make is always going to be a
[14:56] anything about the K-shaped economy. Sure, you can acknowledge that it exists, but you can't alone control CPI, you can't control gas prices, hiring freezes, or Nvidia's earnings reports. So, at least at the very bare minimum,
[15:10] make sure you own some assets. Second, you want to own the boring investments of index funds. So, yes, while 10 companies do make up 40% of the index, that's the argument for investing in index funds, not against them. The top
[15:22] 10 companies in 2010 looked a lot different than the top 10 today. So, if don't have to guess who wins in the following decade. As long as you buy the the top 10, you just own it automatically. And my third takeaway
[15:35] have a buffer since the national savings rate is under 3%. The average American dollar. And if they're doing that, that means they never can build a safety buffer or an emergency fund. They never have a cushion, and that's how they end
[15:50] they might have to default on a loan or basically give up their car. I think you emergency fund before you invest, and that should always be the case. The headline of stocks pushing record highs is always going to be there. In fact, it
[16:04] happens about 20 to 22 times per year. And so, you just need to understand that this machine doesn't really stop. The only thing that changes is whether it's working for you or not working for you at all, and you actually get to choose
[16:16] if it does or doesn't by investing or actively participating in the market. All right, what you guys thought of this video in the comments. How are you feeling about the stock market? I would love to hear from you. If you're trying
[16:28] to invest in the stock market and you've never done it before, or perhaps you are refresher, you want to check out my video right here, my full investing one of my best videos on the channel, and I hope to see you in there. Once
[16:42] this video was a little bit depressing, but hopefully it's not always going to be that way. I will see you in a future video on the channel, and thanks for video on the channel, and thanks for being here. All right, peace.


⚡ Saved you 0h 16m reading this? Transcribe any YouTube video for free — no signup needed.