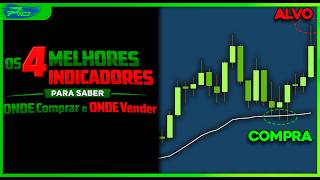

4 Best Day Trading Indicators Revealed
55sDirectly addresses a common pain point with a promise of concrete solutions, and the list format is highly clickable.
▶ Play Clip"Delivers the promised indicator settings but padded with heavy promotion and repeated event pitches."
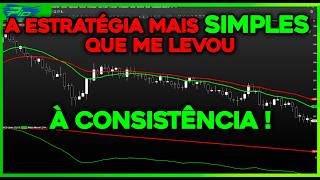
This video presents four technical indicators with optimal settings for identifying precise entry points in day trading, distinguishing between trend legs and pullbacks. The presenter, a trader with proprietary desk experience, shares configurations for the Exponential Moving Average, ATR Stop, Moving Average, and a custom 'Ceiling Breakout' indicator, emphasizing that settings must adapt to trading style. The video also promotes a free three-lesson event and the Pilsar 3.0 method.
The presenter introduces four indicators used as entry triggers: Ceiling Breakout, Hurricane, Exponential Moving Average, and ATR Stop. He emphasizes that indicators are not magic; the key is how they are used and when to avoid them.
The configuration of indicators depends on whether you trade trend legs (momentum moves) or pullbacks (corrections). Trend leg trading requires shorter, more sensitive settings; pullback trading requires longer, smoother settings.
For trend legs, use a 7-period Exponential Moving Average with shift 1, ATR Stop with deviation 0.50, Moving Average with 5 periods, and default settings for Hurricane and Ceiling Breakout. These settings provide support/resistance during the trend leg.
For pullbacks, use a 34-period Exponential Moving Average with shift 1, ATR Stop with deviation 5, Moving Average with 34 periods, and Ceiling Breakout with coefficient 1.40. These settings help capture entries near potential bottoms or tops.
The presenter promotes the Pilsar 3.0 method, which includes his best strategies and robots, and mentions a free three-lesson event for learning the Pilsar 400 strategy.
The video provides practical indicator settings for day trading, emphasizing the importance of adapting configurations to whether you trade trend legs or pullbacks. It also serves as a promotional vehicle for the presenter's paid method and free event.
What are the two trading styles mentioned that affect indicator settings?
Trend leg trading and pullback trading.
03:11
What is the recommended EMA period for trend leg trading?
7 periods with a shift of 1.
06:57
What is the recommended ATR Stop deviation for trend leg trading?
0.50.
07:35
What is the recommended Moving Average period for trend leg trading?
5 periods.
08:25
What is the recommended EMA period for pullback trading?
34 periods with a shift of 1.
14:44
What is the recommended ATR Stop deviation for pullback trading?
5.
15:11
What is the recommended Moving Average period for pullback trading?
34 periods.
15:25
What is the recommended coefficient for Ceiling Breakout when trading pullbacks?
1.40.
16:05
Indicator Settings Depend on Trading Style
This is the core principle of the video: the same indicators require different configurations for trend legs vs. pullbacks.
03:11EMA 7 for Trend Legs
A concrete, actionable setting that traders can immediately apply to their charts.
06:57EMA 34 for Pullbacks
Shows the contrast in settings, reinforcing the need to adapt to market conditions.
14:44Promotion of Pilsar 3.0
Highlights the commercial intent behind the video, which may affect its perceived value.
17:53[00:01] precise entry point in day trading, or if you're still entering a trade because it seems like trading blindly. And to help you with that, today I'm going to show you four indicators with the best settings that I actually use
[00:15] as entry triggers in my own strategies. It's not theory, battlefield, trading with real money, operating through proprietary desks. I tested it in backtesting, I tested it in forage testing, I tested it in
[00:29] practice. So, without further ado, man. The four indicators are ceiling breakout, hurricane, exponential moving average, moving average, and ETR stop. But be warned, indicators
[00:41] aren't magic. What changes the game is how you use it, what criteria you use, and, most importantly, when you don't use it. That's why I'm now going to show you exactly how I apply each of them as a
[00:55] technical and objective entry point. Come with me, man. Dude, to prove that it's possible to start on day 3 with little money, I took R$ 274 and took the AXA proprietary trading desk exam. And I passed on my first try, without taking any losses,
[01:09] without improvising, using only a simple and objective strategy, the Pilsar 400. And after being approved, man, I automated that strategy. I turned her into a robot. And I left that robot running automatically on the
[01:23] proprietary trading desk for a month, while I went about my life until that robot hit its monthly target. And to show you and deliver all of this to you, I've created a free three-lesson event here on YouTube. This week, from zero to the
[01:36] owner's table. Dude, I'm going to show you how I passed this test on my first try using this strategy of mine and then this robot of mine. And in the first lesson of this free event, you'll see the complete plan I put together to
[01:49] complete plan I put together to start day trading with just 274. You'll see the operations I performed in full during the Axia exam, how the Pilsar indicator and coloring work, which is the basis of the Pilsar 400 strategy and
[02:04] also the robot. And of course, you'll be able to download and test a pulse indicator and color pulsar for a certain period to see if it matches your operational profile. In the second lesson, you 'll see the complete setup of the
[02:17] PSAR 400 strategy, the step-by-step operation of the strategy, the backtests, all the trades I made, and the performance report that proves its approval by Axia. And finally, in the third and final lesson,
[02:31] you will see the configuration of the Pilsar 400 strategy robot, and you will see the operations recorded in real time with this robot until it reaches the monthly goal on AXIA. You'll also see the performance report for this robot and you'll be able to
[02:45] performance report for this robot and you'll be able to download and test the robot that automates my strategy for the SAR 400. So, if you want to learn a simple, replicable, and practically validated method , click the link below and I'll guarantee
[02:58] your spot, okay? I'll see you in class. Do you prefer to trade on the trend leg or on the pullback? Dude, now comes a really important part. The configuration of these indicators is not fixed; it depends on how you choose to
[03:11] operate in the market. If you follow this channel, you already know that we avoid sideways market movements and focus on the trend in 99% of our strategies. Within a trend, there are two completely different moments: the trend leg and the
[03:25] pullback. If you like to trade on the trend leg, you need more sensitive indicators with shorter timeframes, understand? Now, if you like to trade on pullbacks, you need
[03:38] smoother indicators with longer-term setups. Wow, Pio, you've really blown my mind! I didn't understand anything, I was kind of lost. No problem, man. Let's level the playing field now. What are trend legs and pullbacks? Dude,
[03:50] when the price is trending upwards, it doesn't go up in a straight line. Everyone knows that. He moves forward, corrects, moves forward, corrects again. So, these price increases in favor of the trend, in this case an upward trend, are the
[04:04] upward trend legs. And these corrections, right, these pullbacks that the price makes, are the pullbacks in an upward trend. Wow, if you're part of the PStar 3.0 method, it's easier for you to identify trend legs and
[04:18] pullbacks because you received my Pilsar coloring. So, the candles that are light green indicate an upward trend leg . So, as long as the candles are light green, you already know that the
[04:32] price is in an upward trend leg . And when the candles turn this here too, look, dark green, it means that we are in a pullback, we are in a price pullback . So, if you have the
[04:45] Pilsar coloring, it becomes easy to know when you are in an uptrend leg. And the coloring also shows, man, that when the candles are light red, as is the case here, and here
[04:58] in front, it means we're in a downtrend leg, you understand? And when the candles turn dark red, as is the case here, as is means that we are in a downtrend pullback, in this case.
[05:12] So the Pilsar coloring process already provides all of that, ready to go. Now, dude, if you're not a student and don't have that pulsating coloring, relax. I've already left a video in the upper right corner where I explain how to identify
[05:24] trend legs and pullbacks using another tool, which is the then come back here, okay? Okay, man. Now that we're all on the same level, we can move on to the next stage. Trend leg settings.
[05:38] Dude, in recent years I've preferred trading trend legs more than pullbacks. And why? Because, man, that's where the market is why? Because, man, that's where the market is flowing, that's where the price pulls back the least, that's
[05:50] where the movement tends to be cleaner, you know? And that's precisely why, man, you can't use heavy indicators with long settings, trending leg. So, for example, here we have, look, an upward trending leg
[06:04] . We then have a pullback and then a new upward trend leg . If I want to trade, man, during upward trend legs, I indicator, for example, a 34-period exponential moving average, because
[06:19] during the upward trend leg, the price is advancing with very few pullbacks. Therefore, no candle during the uptrend leg will touch a 34-period moving average. This will only happen during, get this, the pullback.
[06:32] During a pullback, the 34-period moving average will be touched, but during the upward trend, this will not happen. This means that to operate during upward trend legs, we need
[06:45] indicators with shorter-term settings . So let's get to the settings. Instead of using a 34-period exponential moving average, we go into the settings and change the period here to seven periods with a
[06:57] shift of one, as I said, kind of exponential. Now that's more like it, man. Now the story changes, as you can see. Look, the price is already touching that point, the moving average. So here we might be buying within our
[07:09] upward trend leg. We could also be buying here, look, doing two transactions, right? So, in those two instances, the moving average already functioned as an entry point, as support within that upward trend leg
[07:23] . So, this is the configuration I would use on the exponential moving average to use it as support, as an entry point during an upward trend leg. Now, if I were to use an ATR stop, man,
[07:35] I wouldn't use it in the default configuration. I would double-click on it, come here to the detour and put, look, 0.50. Therefore, this indicator, man, is able to generate several entry points for me
[07:47] during the upward trend leg . So, every time the price during the upward trend leg touches the stop up to the green R, look, it touched here, touched here, touched here, here too several times here, look, and here it failed,
[08:00] right, breaking through the stop, but all the other times here, look, we had good entry points during the upward trend leg, until we had here, look, a failure, but notice how the ETR stop, man, moves very close to
[08:13] the upward trend leg in this shorter configuration that I showed you. So, this would be the setting I would use for the ETR stop if I were trading on upward trending legs. Now, about the moving average, and
[08:25] if you don't have it, download it, okay? I wouldn't use it with 34 periods, I would use it with five periods. Notice that we also have good
[08:39] signals, good entry points, in fact, good support levels using the moving average. So, during the upward extension leg, if I were to use the video entry moving average , I would use it in the
[08:51] five-period setting, okay? And finally, dude, I'd use the "hurricane" and "ceiling piercer" indicators in the default configuration, okay? This indicator, man, is excellent in this default configuration for
[09:03] use during an uptrend leg. Actually, man, I'm using this indicator in a strategy to perform an advanced evaluation of Axia. And this indicator, combined with the Pilsar coloring, is
[09:16] wreaking havoc on the mini index. Man, it's going really well. This strategy of mine is likely be included in the Pilsar method next month . But continuing, man, this indicator is a real headwind, it forms a sort of channel for the
[09:29] price, right? If we're within an upward trend leg, what bottom part of the channel, right? Because we're going to want to buy. So, look, here he created a good entry point. Look, right here. Up here,
[09:42] he created another good entry point as well. And here he failed, didn't he? The But dude, you can see that those are pretty solid supports, right? The price goes down, then goes up again, goes down, goes up again, goes down, and goes up again. Right? So this
[09:57] default setting of the "piercing the ceiling" indicator is excellent for trading upward trend legs as well , okay? Now take a look at this example, man, here in the mini-dollar, on the 5-minute timeframe, notice
[10:09] that the logic remains the same. Here we have a downward trending leg, because the candles are light red, right? Next, we have a pullback, because the candles turned dark red. And then we have a
[10:21] new downward trending leg. If I 'm someone who likes to trade during downtrend leg, I can't just come here and set a 34-period moving average, because the price during a downtrend leg
[10:35] won't reach a 34-period moving average . The 34-period moving average will only be reached during the pullback, as you can see. Look, most of the time that's what's going to happen. Look, it's only during the pullback that a
[10:47] longer moving average is reached that I can use as resistance, as an entry point. So, if I'm a guy who likes to trade only on trend legs, I need shorter setups, like for
[10:59] seven-period exponential moving average with a one-period offset, entry points, as you can see, to be trading during the downtrend legs. Look, notice
[11:11] how many times the price touched the moving average during the downtrend leg , touches where we could have executed good using this as an entry point. In reality, it would fail here, right, in this
[11:25] entry points earlier. And then when this new downtrend leg started here, look, again, good entry points that we could be using within our strategy. So this would be a good setup
[11:38] for an exponential moving average. Same thing, stop ETR. So you have several entry points, right? Set an ETR stop of 0.50. Several good entry points, look, good points of sale, okay? This is using the ETR stop
[11:51] sale, okay? This is using the ETR stop set to 0.50. We also have the average over five periods. Notice that, look, there are several good points of entry for sales. Look, it would fail down here, but up here we would again have
[12:04] several good entry points for selling, using the five-period video moving average . And as I showed you, we also have the furateto furachão in the standard configuration, which also gives us , look, several good
[12:17] entry points. Look, excellent entry points. With this configuration within alright, man? So, in summary, the settings I would use to trade during a trend leg, both up and down, would be a
[12:30] seven-period exponential moving average, a " breakthrough ceiling" option in the default configuration, an ETR stop with a deviation of 0.50, and a five-period video moving average. Okay, man. Now you know the best settings for
[12:44] using these four indicators when you want to trade on the trend leg. But now, dude, what about when you want to trade pullbacks? Wow, that changes the game. And that's what I'm going to show you now. Settings for pullbacks. Wow, P,
[12:58] but why do some people like to trade on pullbacks? It seems more advantageous to trade only on trending legs. Dude, when we trade trending legs, the advantage is clear. We have a movement there that is normally
[13:11] cleaner, less noisy, but there is a risk. You might be trading near the top of an uptrend or selling near the bottom of a downtrend. And then the stop sign comes right in our face, doesn't it? That's precisely why
[13:24] many people prefer to trade pullbacks. Because when you trade a bullish pullback, for example, you're looking for the following scenario: wow, the market is correcting within an uptrend and I'm trying to
[13:38] position myself before the start of the new uptrend leg, you understand? So the advantage is that you can be buying closer to the bottom, you understand? So that's the advantage of trading using pullbacks. To trade
[13:51] pullbacks, you need longer-term setups on the indicators. Because look 1-minute timeframe of the mini-index, and here we have a pullback. Look, these candles here are dark green. This means that we have a
[14:06] pullback in a classroom trend. And you can't place indicators with very short settings during a pullback because of this. Notice that we have now added the "hole-piercing hurricane" indicator. If you place this
[14:19] indicator during a pullback, you'll notice it will fail multiple times because the price will keep crossing this indicator, even during the decline. It won't make sense to you. You'll have several entry points,
[14:32] but man, those entry points are going to be of very low quality. longer settings during the pullback. So, if I'm a guy who wants to trade during a pullback to have
[14:44] the possibility of opening a trade near a potential bottom, I'll never use a seven-period moving average . I'm going to modify the moving average to, for example, 34 periods, exponential type, with a shift of one. That's it
[14:57] , man, I'll have a good entry point at the moving average, in this case, the 34-period exponential moving average. So, this would be the configuration I would to be trading within a pullback. Now, regarding the ETR stop, man, I
[15:11] can't use 0.50 either; I need a different configuration. And I would use a deviation of 5, keeping everything else the same, period 20, arithmetic type, only changing the deviation to five. Therefore, the ETR stop becomes
[15:25] support for us. Look, this is a good entry point for buying, in this case during the pullback. I would also use the Vidia moving average in the 34- period setting. You realize, man, that she gets the price down here, right at the
[15:39] bottom, right? In this case, on January 23, 2026, at a 1- minute timeframe. Look, the moving average captures the price during the pullback right at the bottom . So this would be an excellent entry point. And to finalize the
[15:52] configuration I would use for the ceiling-drilling, floor-drilling system. Actually, man, this indicator isn't that good for use in pullbacks, but we can do the following: we set its coefficient value to 1.40,
[16:05] keeping the D1 shift the same, okay? Click OK. And then we'll have an entry point during the pullback here. But dude, like I said, the " bursting ceiling" indicator isn't the best option for trading
[16:18] during pullbacks. It works much better during trending legs. These other indicators here—the exponential moving average, the ETR stop, and the moving average— offer a better advantage during a pullback. And these settings that I
[16:32] 'm showing you mean that, man, the indicator is only triggered when the price is close to a potential bottom region, as was the case here. And of course, man, the same applies in a downtrend. If
[16:45] you like to trade using pullbacks, you could set a 34-period moving average, and the price would eventually hit the 34-period moving average during that pullback movement, right? During this pullback.
[16:57] told you, a "ceiling-piercing, floor-piercing" indicator, although it's not the best case, it worked very well. Look, look where the price hit the " breakthrough ceiling" indicator during the pullback. Right up here. Look, check out
[17:12] another pullback here. Look, the candles turned dark red. We could use the ETR stop with offset. Notice how the price hits the ETR stop right here, look, during the pullback. Beauty? In this other case here, we could
[17:25] use the moving average. With a 34-period cycle , look, during the pullback, a good entry point for selling, right? Okay, man. Now you also know exactly how to adjust these four indicators
[17:39] when the goal is to trade on pullbacks. Of course, right? Not everyone has the time to spend testing indicators in different configurations and developing strategies and robots. That's why I created the
[17:53] complete Pilsar 3.0 method, where I bring together my best robots and strategies. These are the same strategies and robots that I use in my day-to-day work, and I also use them to get approved by proprietary trading firms. That's it, man. In the description of
[18:07] this video, you'll find a link that will take you directly to a page where I show more details about the complete Pilar 3.0 method. And if the positions are closed when you click the link , don't worry, just
[18:19] contact us on WhatsApp and we'll see if we can find a spot for you, okay ? Test these entry points with these settings in your strategies, run backtests, and see if it makes sense for you. If it makes sense,
[18:34] subscribe to this channel with notifications turned on, because I'm not going to rest until successful trader. I'll be staying here, man, and see you in the next video. Dude, to prove that it's possible to start on day 3 with little money, I took R$ 274
[18:50] and took the AXA proprietary trading desk exam. And I passed on my first try, without taking any losses, without improvising, using only a simple and objective strategy, the Pilsar 400. And after being approved, man, I automated that strategy. I
[19:04] turned her into a robot. And I left that robot running automatically on the proprietary trading desk for a month, while I went about my life until that robot hit its monthly target. And to show you and deliver all of this to you, I've created a
[19:18] free three-lesson event here on YouTube. This week, from zero to the owner's table. Dude, I'm going to show you how I passed this test on my first try using this strategy of mine and then this robot of mine. And in the first lesson of this
[19:31] free event, you'll see the complete plan I put together to start day trading with just 274. You'll see the operations I performed in full during the Axia exam, how the Pilsar indicator and coloring work,
[19:47] which is the basis of the Pilsar 400 strategy and also the robot. And of course, you'll be able to download and test a pulse indicator and color pulsar for a certain period to see if it matches your operational profile. In the second lesson, you
[20:01] will see the complete configuration of the PSAR 400 strategy, its operation, step-by-step, the backtests, all the trades I made, and the performance report that proves its approval by Axia.
[20:15] Finally, in the third and final lesson, you will see the configuration of the Pilsar 400 strategy robot. You will see the operations recorded in real time with this robot until it reaches the monthly goal on AXIA. You'll also see the
[20:29] performance report for this robot and you'll be able to download and test the robot that automates my strategy for the SAR 400. So, if you want to learn a simple, replicable, and practically validated method , click the link below and I'll guarantee
[20:44] your spot, okay? I'll see you in class.
⚡ Saved you 0h 20m reading this? Transcribe any YouTube video for free — no signup needed.