
4 Best Day Trading Indicators Revealed
51sInstantly names the exact indicators, promising clarity and consistency for viewers overwhelmed by chart clutter.
▶ Play Clip"Delivers on the promise of four indicators with specific settings, but includes a lengthy promotional segment for a paid course."
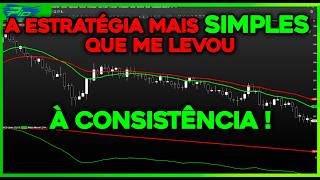
The video presents four essential indicators for day trading in mini-index and mini-dollar futures: Flow Diffuser, ATR Stop, Donchian Channel, and Pilsar. The creator shares optimal settings for each, explains their roles within a complete strategy, and emphasizes using them together for clarity and consistency.
The video covers Flow Diffuser, ATR Stop, Donchian Channel, and Pilsar indicator, focusing on best settings and usage in mini-index and mini-dollar futures.
Created by Brazilian analyst André Moraes, the Flow Diffuser is an evolution of MACD, using three moving averages to analyze short, medium, and long-term trends simultaneously.
For mini-index day trading: long-term average 305 periods (green), DF 72 exponential with shift 1 (red), DF+ 35 exponential with shift 1 (yellow).
When green line is below red, and red below yellow, it indicates a downtrend. When crossed upwards, it signals an uptrend.
Created by Welles Wilder, the ATR Stop is a trailing stop that adapts to volatility. The creator uses it as support and resistance for entries.
Default: period 20, arithmetic, deviation 2.0. Alternative: deviation 0.50 for closer levels. Red acts as resistance, green as support.
Created by Richard Donchian, it shows the highest high and lowest low over a period. Breakouts indicate new highs/lows, useful for trend-following.
Common periods: 72, 144, 610, 1292, with offset 1. The creator prefers 72 and 144 for mini-index, and 144 for mini-dollar.
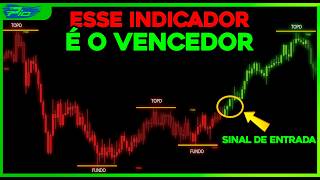
A custom indicator that marks tops and bottoms of primary, secondary, and tertiary trends, with candle coloring to indicate trend direction and legs/pullbacks.
Using Pilsar with Flow Diffuser and ATR Stop can provide objective entry points, e.g., red candles with downward Flow Diffuser and price retracing to ATR stop.
The video emphasizes that no single indicator is perfect, but combining these four can create a robust day trading strategy. The creator encourages testing and adapting settings to individual trading styles and assets.
Who created the Flow Diffuser indicator?
Brazilian analyst André Moraes.
00:41
What is the recommended period for the long-term average in the Flow Diffuser for mini-index?
305 periods.
01:47
What does the ATR Stop indicator do?
It calculates a trailing stop based on market volatility, adapting to market conditions.
05:30
What is the default period and deviation for the ATR Stop as mentioned?
Period 20, deviation 2.0.
06:14
Who created the Donchian Channel?
Richard Donchian.
10:49
What does the Donchian Channel show?
The highest high and lowest low over a given period, indicating market range.
11:04
What are the preferred Donchian Channel periods for mini-index?
72 and 144 periods.
14:39
What does the Pilsar indicator mark?
Tops and bottoms of primary, secondary, and tertiary trends.
15:46
What do light red candles indicate in the Pilsar coloring?
A downtrend leg.
17:50
What is the recommended combination for a complete strategy?
Flow Diffuser for trend, ATR Stop for entries, Donchian for breakouts, and Pilsar for objective price action.
21:54
Flow Diffuser Evolution
Explains how the Flow Diffuser improves on MACD by using three moving averages for multi-timeframe trend analysis.
00:41ATR Stop Adaptability
Highlights how the ATR Stop adjusts to volatility, making it a dynamic support/resistance tool.
05:30Donchian Channel Origin
Connects the indicator to Richard Donchian, a pioneer of rule-based trend following.
10:49Pilsar Objective Price Action
Demonstrates how the Pilsar indicator provides objective trend and leg identification through coloring.
15:46Combining Indicators
Shows a practical example of using multiple indicators together for entry signals.
21:54[00:01] favorite indicators for day trading right now. Flow diffuser, ATR stop, Donchan channel, and Pilsar indicator. And today I'm going to show you the best settings I've found for each one, how I use them effectively in
[00:15] the mini-index and mini-dollar futures, and, most importantly, what role each indicator plays within a complete strategy. So, if you want to stop getting lost among 20 indicators on the chart and start trading with
[00:27] criteria, clarity, and consistency, this lesson is for you. Come with me, man. First indicator, flow diffuser. Dude, hands down. This is the best support indicator I've ever used, and I've found a
[00:41] configuration that's fantastic, especially for day trading in mini- index futures. But to understand the root of this indicator, here's the thing: the flow diffuser was created by the Brazilian analyst André Moraes. Basically,
[00:54] this indicator is an evolution of the MACD, but with a very important difference. The traditional MAC uses only two moving averages to measure momentum. Now, the flow diffuser uses three layers of trend analysis; that is, it
[01:07] analyzes the short term with a shorter average , the medium term with an intermediate average, and the long term with a longer average. All of this at the same time. And that, man, completely changes how you read the market, because when you
[01:21] have those three forces aligned, it means that the flow of buyers or sellers is truly dominating the market. And since I've been using this indicator for many years, I've found a fantastic setup,
[01:34] especially for day trading in mini- index futures. This is the configuration I'm going to flow indicator into your profit chart, it will appear like this. So all you have to do is this: first click here, look, on diffuser,
[01:47] right here in front, see, double-click. In the long-term average, you would input 305 put 144 periods. And I like to add the color green to that line. Click OK. And now I'm going to double-click on the DF—here in the DF—man, I put the
[02:02] period as 72, keep the exponential type, and put here, look, a shift of one. In terms of appearance, I would use the color red. I click OK. Finally, I double-click on DF+. I come here, look, and change it to 35, exponential type,
[02:16] with a D1 shift. In terms of appearance, I would use the color yellow. And that's it, man. This is the best configuration I've ever found for the flow diffuser in the mini index. The reading is very simple. If I arrive at the market and observe that the
[02:28] here, look, green line below the red line, red line below the yellow line, then I consider that I have a downward direction, a price to keep falling than to start rising. Now, from the moment
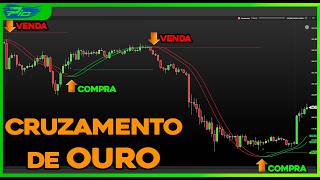
[02:42] the flux diffuser does this, look, it crosses all the lines upwards, and the three lines end up crossed upwards, as is the case here. Notice, we have the green line above the red line, and the red line above the
[02:55] flow diffuser in this way, I start to believe in an upward movement, I start to believe in an upward trend. As you can see here, the price is more likely to continue rising than to start falling. This is
[03:08] look at the next trading session, March 3rd. Look, we've arrived at the graph, and we can see that the flux diffuser has all three moving averages crossing downwards in showed you. In that case, then, I will be relying
[03:22] solely on sell operations within my strategy . If I get any just believe the sell signal. Now, from the moment the flux diffuser changes its direction like this, look, the averages cross
[03:35] showed you, look, the three averages moment on, I will only believe in the upward direction, only in the upward trend. If there are any sell signals here in the situation within my strategy,
[03:48] I will ignore them. And you can find several good examples of that in the chart, okay, man? As I said, this, to me, is the best indicator of support I've ever found. It's clear that this indicator isn't perfect, right? For
[04:00] showed us an upward trend, and the price did indeed follow that indicators, the flow diffuser here, look, is no longer upward. But the flow diffuser only demonstrated
[04:14] only here, because the green average crossed below the red average. So at this point, we no longer had an upward trend. However, during all this time here, look, you could most likely have been performing the
[04:26] operations within your strategy. Come back here, look at the mini-index, minute chart, and you'll see situations like this one . Look, the flow diffuser is showing us a downward trend. The price has dropped quite a bit, hasn't it? Look,
[04:39] from this point on, the flow diffuser started showing , look, more or less in this region, we start to see an upward trend due to the flow diffuser. And look, the flow diffuser is rising again in an
[04:52] upward trend. That's why, in my view, this has been the best indicator of support I've ever found. You can create an excellent strategy using this indicator. Beauty? Just one observation, okay? This indicator, in this
[05:04] configuration, works best on the 1-minute timeframe for the mini-index. Let's move on to the next indicator. According to the indicator, stop. Dude, this indicator was created by Els Walder. This is the same person who created
[05:16] famous indicators like the RSI, the ADX, the parabolic chart; in other words, the guy is a genius. And the ETR Stop is an indicator designed to be a trailing stop. It calculates the stop-loss based on market volatility. So here's what happens: if the market
[05:30] is more volatile, the stop-loss order increases. Now, if the market is calmer, the stop loss decreases; in other words, the stop loss adapts to the market's behavior. And that's why this indicator has become very popular in trend-following strategies
[05:45] indicator was created to be a trailing stop, but since this is unconventional, I've always used this indicator as support and resistance in my strategies, man. As an entry point, exactly. And there are several
[05:59] different configurations for us to do this. So, look, the dollar is on the 4R chart and this is the default stop-loss setting. A following. Double-click here, look at the stop and change the deviation upwards,
[06:14] keeping the period at 20, like an arithmetic operation. So, let's say you within your strategy, you saw that the trend was downward. So, all good? Look at all the excellent entry points this indicator generates. Look,
[06:27] entry points in this case of selling, red stop, right? So here you have several good resistance points where you could be executing your strategy. So, let's say, man, that you're creating your strategy, and
[06:40] you have your entry point here , which in this case is the ETR stop in this using the flow diffuser because you watched my video and found the flow diffuser interesting in these settings. In this case, the
[06:52] flow diffuser, which is a support indicator, right, a confirmation indicator, look, from this point on, because the three averages are crossing downwards. Look 'm not saying this is a complete strategy, but it could be
[07:06] right? The flow diffuser is showing a downward trend, and the ETR stop, look on the four-rank chart for the mini- dollar. So if the red ETR stop acts as resistance, the green ETR stop will act as support, as a
[07:20] buy entry point. So you can see that here we have some good entry points for buying, using the Green Sapter as support. Notice that would also be following suit, right? We're now in the Bitcoin futures market, dude, on the
[07:33] 1-minute timeframe chart, right? And you can also use another configuration, arithmetic. And this type of setup, man, makes it difficult for the price to hit the stop loss, but when the price touches this region, it ends up being a
[07:47] very strong region, both as resistance and support. So, when area, you know that you most likely have a strong area a trade here as part of your strategy, right? Notice here, look, the
[08:01] price came in, touched the resistance area, fell again, then touched That's because it's a more demanding setting, right, for the Stop ETR. This type of setup, man, is for those
[08:13] wait for the price to arrive, you know, for those who like this type of strategy, but, man, both the resistance and the support that the Stopetter creates in this setup tend to be very strong. Simply input
[08:26] this configuration into the graph and observe. You will draw your own conclusions. Hey a strategy based on that. We are 1-minute timeframe. So here's the thing, if you're not patient enough
[08:38] to wait for the price to touch such a long ATR stop, you can modify it; you can set a deviation of 0.50. In this configuration, the ETR Stop is much closer to the price. This creates, man, several opportunities for you to be
[08:52] things remain the same. The red Stop ETR is the resistance, so you will be looking to sell at the red Stop ETR, and the green Stop ETR becomes the buy at the green Stop ETR. So this could be a good entry point into
[09:06] you also use, right, the flow diffuser. Look, initially the flow diffuser wasn't showing a trend; in fact, it was showing . Look, we would then have a sideways movement until the moment when the
[09:19] flow diffuser starts showing an upward trend again. So, in the case of this considering here, from the moment the flow diffuser shows an upward trend, you would ignore the red stop-loss signals and focus
[09:33] only on the green stop-loss signals. Then you would have entry points, look, at the green stop-loss signals. Of course, man, if you only use the flow diffuser and the ETR stop in this configuration, your strategy will
[09:46] reality, it's not going to work very well. You're going to end up getting stopped out and encountering flow diffuser is crossed upwards, but even so, look, the price is breaking through the green stop. Leaking the green stopper. Using only these two
[10:00] indicators within a strategy is not enough. A few more additions would be needed you guys get the idea, right? If you prefer to make shorter trades and have an entry point very close to the price, the ETR stop in this configuration
[10:13] downward-facing cross-flow diffuser. In the case of our hypothetical strategy, you would ignore the stops until they turn green, right? I would focus solely on selling
[10:25] at the red stop-loss orders, okay? I would use the red stop losses as resistance, OK, man? So you can do short operations, okay? So this is another component, another indicator that you can use within
[10:37] your own strategy. See if this makes sense to you, test it thoroughly, come back to the chart, and take a look to see if it makes sense within your operational strategy. Let's move on to the next indicator. Third indicator, Doncha channel. Dude, the
[10:49] Doncha channel was created by Richard Don, who is considered one of the fathers of the most modern trend-following strategies . And he was one of the first traders to develop strategies based on objective rules, that is,
[11:04] like, strategies based on evidence, you know? And the idea behind this indicator is extremely simple. The Doncha Channel shows the highest maximum value and the lowest minimum value of a given period. In other words, it shows
[11:20] the market range. When the price breaks through the top of the channel, it means the market has just reached a new high for the period, and when it breaks through the bottom, it means a new low for the period. That's why this indicator became
[11:32] so popular in trend breakout strategies. And dude, with this indicator here, I don't do much fancy stuff, okay? So here's the thing, I double-click on it, remove the central average, go to properties, and I
[11:44] can use periods of 72, or I can use 144 periods, or 610 periods, or even 1292 periods, okay? Let's also like to include the offset of one. Click OK and you're done. Here is
[12:00] Donchan's channel in 72- period mode. And I use this indicator in basically the same classic way, you know? So, for example, if the price starts to break below, look, the bottom of the channel, break below
[12:13] , then I'm going to believe that the price is gaining strength in the downtrend. And that's if the price is hitting the lower part of the the story changes, that is, the trend reverses, because the price touches the
[12:26] upper part of the channel, as it touched here, touched here and here as well, look, upper part of the channel, of course, right? This, combined is touching the brakes of the Judonte channel, demonstrating that the trend has strength. A
[12:40] flux fuser is used to accompany this. Then the price reversed, reversing the upward trend. Flow diffuser, supporting this upward trend reversal, look, buy operations become more likely to succeed. Even more so
[12:53] if an ATR stop is triggered at that moment , right? In a setup here, maybe three people, right? For example, the D3 bypass makes it an even more interesting setup, in my opinion. So, look at the price, in this example,
[13:07] DCH channel, the flow diffuser, look, aligned downwards, price retracing, look, at the red ETR stop. Wow, man, that could make sense within a good strategy, right? I could be
[13:19] selling there, maybe, you know, in those resistance zones. Similarly, when the trend turns upward, wow, the price is there, look, hitting the upper part of the Doncha channel, the flow diffuser is aligned upwards, and the price is
[13:31] retracing to the green stop-loss. Wow, maybe this could work within a strategy here. So, it's worth it, man, for you to test all of this within your strategy. Do a backtest, see if this makes sense within your strategy.
[13:45] But getting back to the focus here, let's go to Doncha's channel. Look, I told you there are other settings for Stop ETR, right? We also have here, look, a 144-period configuration. So this would be the 144-
[13:58] period configuration. We also have the 610-period configuration. Look, that's a pretty heavy configuration, isn't it? Just look. We also have the 1292- period configuration. So, what changes in all these settings, right? What changes,
[14:11] trend reversal. Because here, look, all the channels in Donchasion would be showing a bike trend. But to reverse the trend in would need to rise all this way, look, to touch the upper part of the
[14:25] downward trend. This is using a heavy configuration such as 1292 periods. So, if you decide to use the Donchan channel in your strategy, you'll be changing the settings here, looking around, and seeing which configuration makes the most
[14:39] sense for your strategy, okay? I really like the 144- period and 72-period settings, especially for use with the mini- index, okay? And also in the mini-dollar market. In the mini-dollar market, I prefer the
[14:52] because I've noticed that my strategies work better on the Doncha channel. So it's the same old story, the price is touching the upper part of the believe in an upward trend, especially if I have a
[15:05] that's where you could, perhaps, add an ETR stop, look, in the default configuration, man, it's the same old story, if the price starts touching the bottom of the
[15:17] Doncha channel, I'm going to believe in a strong downtrend here on the dollar. So, dude, test these settings thoroughly, see if they make sense within your strategy, within the asset you're trading. If
[15:30] operations, obviously, don't use it; opt for other indicators instead. Let's move on to the last indicator. Fourth indicator, Pilsar. Dude, I created this Pilsar coloration indicator, and with it I can
[15:46] objectively. I can see the peaks and troughs of the tertiary, secondary, and primary trends there. I can observe trend legs and pullbacks, all a look at this. So I'm going to come here to the chart and change it to my
[16:02] layout, where I have an indicator and pulsating coloring. So this guy is the pulsating coloring. So this guy is the indicator and coloring pioçar. Tsar marks the top regions for me, and fsar marks the bottom regions for me. When the
[16:16] candles are red, I know we're in a downtrend. When the candles are green, I know the trend is upward. All of this is something very interesting here, man. If I double-click here, look, in "
[16:30] piçar," you'll see trend one. Trend One means that the PSA indicator is marking for us the tops and bottoms of the primary trend. So, if indicator will start showing
[16:43] me, look, the tops and bottoms of the secondary trend, because now I've set it to the color, look, I right-click on any candle, I go to pulse properties, you'll see that it will be trend one, the color
[16:56] primary trend for me. Now, if I change it here, look, to two and click OK, the coloring will now be marking the secondary trend for pulse indicator and change it to three, now I'll have, look, the tops and bottoms
[17:10] of the tertiary trend. And if I change the coloring here too, look, properties, remove hair and change to trend three, now the coloring will show me the tertiary trend of the market. All of this within a single
[17:22] indicator, right? And the coloring and everything, in a completely objective way. primary trend. So, coloring, primary trend, indicator, primary trend example here, what happened here? If the candles are
[17:36] red, the trend is downward, period . However, there are two shades of red. Here we have, look, a lighter red and here we have a see, when the candles are a lighter red, it means I
[17:50] 'm in a downtrend leg . So here I have a downward trending leg. Wow, that's a downtrend leg of the primary trend, which is the strongest trend
[18:05] strategy, you have a great chance of being very successful in short selling, because it's a trend leg of the primary trend. Now, when the candles turn dark like this, it means we're in a
[18:18] pullback, meaning the price is correcting or recovering. So, at that can say: "Wow, I'm going to stay out of it." Because the price might retract significantly red and clear again, you can go back to looking for sales.
[18:33] You know you're already in a new downtrend leg of the primary trend, understand? So, man, using the Pilsar indicator here to mark, look, the tops and bottoms, look, TSR up here means that we
[18:45] have a top. The 'Fs' below means that we have a primary trend bottom down here, top up here, bottom down here. Look, these are descending tops and bottoms of the primary trend. You already know that when the candles are
[18:58] a primary trend leg. Dark red, you're in a strategy it would be interesting for you to use an ATR stop with three periods here, right? So, for example, while the candles are light red, you
[19:12] bottoms. Perhaps it would be interesting if you were looking for sales strategy. I don't know what kind of operation you have, do you ? I don't know how your strategy works, but this could be interesting within your strategy. If
[19:25] our hypothetical strategy, right? He's back to doing leg surgery on sick leave, right? But if they turn red color again, you know? That's clear, I repeat, I don't know how
[19:38] your strategy works, it's just an idea. That would be using the primary trend, but primary trend. I personally quite like the secondary trend. In most of secondary trend. So, here's number two. So, the tops and bottoms
[19:51] are now part of the secondary trend, and it changes here. Look, coloring also plays a role in the secondary trend because it's not as weak as the tertiary trend and it also gives me more signals than the primary trend. So, for example,
[20:04] bottoms, look, through the secondary trend. And I'm seeing, look, the . Look, the trend is reversing to an upward trend. Look, the was on March 3rd, in the mini- index. We had descending tops and bottoms
[20:19] Pilsar indicator, indicating a downtrend. We witnessed a reversal here from a we've started to see ascending tobos and funnos through the pilar indicator. You could see that simply by looking at the color of the candles, right? Look, from here to
[20:34] here the candles turned red, look. And from that moment on, the trend reversed from this point here, look. And then the trend became light red candles, low-profile legs in the co. Dark red candles
[20:49] again, downward trending leg. And then when the trend reversed to an upward trend, it's like this: light green candles, upward trend leg. The candles turned dark green, as is the case here, pullback, light green
[21:02] again, bullish trend, pullback, bullish leg, pullback, and so on. Got it, man? We had a significant upward trend here, right? Look, only light green candles. It got up here, and we had a
[21:14] trend reversal. Look, the tops and bottoms happened this way here. Look up a downward trend, look. And I repeat, you can only observe this through the coloring. Throughout this entire period here, the candles remained green. It got to
[21:27] this point up here, look, the candles turned red. From here on, Red candles, downward trending legs. Legs trending from the bottom all the way down here. Candles turned dark red, pullback, light red,
[21:40] downtrend leg again. Did you understand? So, man, the Pilsar indicator and coloring gives us the objective price action . We can objectively understand what the price is doing . So, if we combine this with
[21:54] a flow diffuser along with an ATR stop, look, wow, red candles here indicating flow diffuser also showing a downward trend . The price is retracing here in the region of the ETR stop, right, the three-period one I 'm using here, look, it could be
[22:08] Ah, the trend has reversed here, look, judging Flow diffuser followed. The price is pulling back here, look, at the ETR stop. It might be interesting to buy. We wouldn't buy here, even though the
[22:22] flux diffuser was showing an upward trend for us, the pilsar coloring we wouldn't buy here. So, man, since this Pilsar indicator and coloring makes Price Act a target, it can be excellent within your own
[22:36] strategy. And this indicator is part of my training. Complete Pilsar Method 3.0 or Pilsar Method 3.0 manual strategies. Inside, students receive the Pilar indicator and coloring , which are the basis of the strategies
[22:51] I use in my trading, in the mini-index and mini-dollar futures. The complete Pilsar 3.0 is where we have not only the strategies but also the robots. Now, strategies but also the robots. Now, Pilsar 3.0 manual strategies is where,
[23:04] of course, we only have the manual strategies, but there you also get the Pilsar indicator and coloring. But if now is not the right time for you to participate in the Pilsar 3.0 method, don't worry. On March 29th, 30th, and 31st, the "
[23:19] From Zero to Proprietary Table" week will take place here on the channel . This is a free event where I'll demonstrate a challenge I took on starting day trading on a proprietary trading desk with just R$ 274,
[23:32] man. With that amount, I took the beginner exam for the Axia proprietary trading firm, where the target was R$800. I passed on the first try using a simple and objective strategy, the PSAR 400 strategy. Then I automated this
[23:45] strategy, created a robot for it, and let it operate until it generated enough money to pay for the advanced exam , where the target was R$ 4,000. And I also passed that test
[23:59] using my robot and strategies utilizing color and the pulse indicator. And during Zero Owned Desk Week , I'll show you all of that. And right in the first lesson you 'll see the complete plan
[24:11] I made to start with R$ 274 in day trading. The operations I performed in full during the Axia exams I took. I'll show you how to use the Pilsar indicator and coloring. And of course, you'll be able to download and test this
[24:24] indicator for free for a certain period. You will also be able to download the robot so that you can operate it in an automated way for a certain period of time. It will be free for you. In other words, even if you're not yet a
[24:36] student in the training program, you'll be able to experience the Pilar coloration indicator in practice, okay? So, if you'd like to participate, the link video description. Well, buddy, now it's up to you. Carefully study each of
[24:50] these indicators, test them in different configurations, and, most importantly, try to incorporate them into your strategies. I 'm sure they can greatly improve their day trading results. Hey man, if this video added value to you in any
[25:04] content is worthwhile, then please leave a like, activated, because I'm not going to rest until you become a successful trader or achieve your goal . I'll be staying here, man, and see you in the next video.
[25:20] day trading with little money, I took R$ 274 and took the AXA proprietary trading desk exam. And I passed on my first try, without taking any losses, without improvising, using only a simple and objective strategy, the Pilsar
[25:34] 400. And after being approved, man, I automated that strategy. I turned her into a robot. And I left that robot running automatically on the proprietary trading desk for a month, while I went about my life until that robot
[25:48] hit its monthly target. And to show you and deliver all of this to you, I've created a free three-lesson event here on YouTube. This week, from zero to the owner's table. Dude, I'm going to show you how I passed this test on my first try
[26:01] using this strategy of mine and then this robot of mine. And in the first lesson of this free event, you'll see the complete plan I put together to complete plan I put together to start day trading with just 274.
[26:14] You'll see the operations I performed in full during the Axia exam, how the Pilsar indicator and coloring work, which is the basis of the Pilsar 400 strategy and also the robot. And of course, you'll be able to download and test a pulse indicator and
[26:29] color pulsar for a certain period to see if it matches your operational profile. In the second lesson, you will see the complete configuration of the PSAR 400 strategy, its operation, step-by-step, the
[26:42] backtests, all the trades I made, and the performance report that proves its approval by Axia. Finally, in the third and final lesson, you will see the configuration of the Pilsar 400 strategy robot. You will see the
[26:57] operations recorded in real time with this robot until it reaches the monthly goal on AXIA. You'll also see the performance report for this robot and you'll be able to download and test the robot that automates my strategy for the SAR 400.
[27:12] So, if you want to learn a simple, replicable, and practically validated method , click the link below and I'll guarantee your spot, okay? I'll see you in your spot, okay? I'll see you in class.
⚡ Saved you 0h 27m reading this? Transcribe any YouTube video for free — no signup needed.