

How I Made $6k Trading on Vacation
44sThe promise of earning money while relaxing on vacation is highly appealing and taps into the desire for financial freedom and lifestyle flexibility.
▶ Play Clip"Title promises a big gain but delivers a thin, vague explanation with no real educational depth."
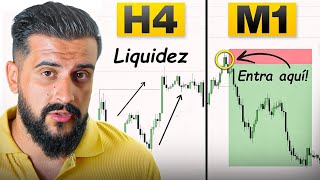
The video demonstrates a simple trading strategy executed while on vacation, focusing on liquidity zones and timeframe analysis. The trader explains how they identified entry and exit points using one-hour, 15-minute, and 5-minute charts, resulting in a high reward-to-risk ratio.
The trader explains they were trading while on vacation, using a simple strategy based on highs and lows on the one-hour timeframe.
The strategy involves buying below lows and selling above highs, as these are areas where market liquidity is concentrated.
After price cleared a high, the trader switched to the 15-minute timeframe and marked an RB (a wick that extinguishes the previous wick).
On the 5-minute timeframe, the trader waited for price to touch the RB area and entered on the second bearish reaction candle, with a stop loss above the old high.
The take profit was placed in the next liquidity zone, and the price plummeted, resulting in a reward-to-risk ratio of over 15.
The video showcases a straightforward, repeatable trading approach that leverages liquidity zones and multiple timeframes, achieving an exceptional risk-reward outcome.
What is the core strategy described in the video?
Buy below lows and sell above highs, as these are liquidity zones.
00:16
What does RB stand for in the context of this strategy?
A wick that extinguishes the previous wick.
00:28
What timeframes are used in the strategy?
One-hour, 15-minute, and 5-minute.
00:01
Where is the take profit placed?
In the next liquidity zone.
01:00
What was the reward-to-risk ratio achieved?
Over 15.
01:00
Liquidity-Based Strategy
Explains a clear, actionable principle: trade where liquidity is concentrated.
00:16Multi-Timeframe Approach
Demonstrates a systematic method of shifting timeframes for precision.
00:28Exceptional Risk-Reward
Shows a real outcome with a ratio over 15, illustrating the strategy's potential.
01:00[00:01] trading while on vacation, and I'm going to explain how I did it. All I did highs and lows on the one-hour timeframe, since my
[00:16] trading strategy is very simple and all I do is buy below do is buy below lows and sell above highs, as that's where all the market liquidity is. Once the price had
[00:28] cleared that high, I switched to the 15-minute timeframe and marked this RB that you see here. Basically, it's a wick that extinguishes the previous wick. Then I switched to the 5-minute timeframe and waited for
[00:44] the price to touch that area. Once the price touched that RB on the price touched that RB on the 5-minute timeframe, I entered the second bearish reaction candle, covering myself with my stoplos above the old high. And I
[01:00] placed my TP in the next liquidity zone, and the price ended up liquidity zone, and the price ended up plummeting, giving me approximately a ratio of, as you can see here, over 15.
[01:17] Absolutely crazy and very easy to analyze. If you want to know more about my trading strategy, follow me on Instagram. Yeah.



⚡ Saved you 0h 01m reading this? Transcribe any YouTube video for free — no signup needed.