
3 Moving Averages + RSI Setup
44sViewers love quick, actionable indicator setups; this clip shows exactly how to configure the strategy.
▶ Play Clip"Title accurately describes a 1-minute binary option strategy using moving averages and RSI, though results may vary."
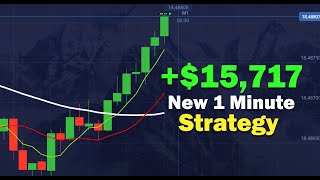
This video presents a binary options trading strategy using three moving averages (SMA periods 5, 13, and 45) and an RSI indicator (period 5) on a 1-minute candlestick chart with 1-minute expiration. The trader explains entry rules based on trend direction, moving average crossovers, candlestick patterns, and RSI overbought/oversold conditions.
Three SMAs: period 5 (green, 2px), period 45 (white, 4px), period 13 (red, 2px). RSI period 5 (white line, 2px) with 70% (blue), 50% (gray), 30% (yellow) levels.
Uses 1-minute Japanese candlestick chart and 1-minute expiration time for binary options.
The 45-period SMA indicates overall trend: if candlesticks are below it, market is bearish; if above, bullish.
Look for intersection of the 13 and 5 period SMAs. For a sell trade, the crossover should occur below the 45 SMA; for a buy, above.
RSI must confirm the trade direction: for downtrade, RSI should be moving downward; for uptrade, RSI should break above the 70% blue line (overbought) or below 30% (oversold).
After crossover, wait for a strong candlestick formation (e.g., consistency) before entering the trade.
For sell trades, RSI should be in oversold condition (below 30% yellow line). For buy trades, RSI should be in overbought condition (above 70% blue line).
The strategy combines trend identification via the 45 SMA, entry triggers from the 5/13 SMA crossover, and confirmation from RSI extremes and candlestick patterns. The trader demonstrates multiple winning trades on a 1-minute chart.
What are the periods of the three moving averages used?
5, 13, and 45.
00:01
What type of moving average is used?
SMA (Simple Moving Average).
00:01
What is the RSI period setting?
5.
01:02
What chart timeframe and expiration time are used?
1-minute candlestick chart and 1-minute expiration.
01:35
How does the 45-period SMA indicate trend direction?
If candlesticks are below it, the market is bearish; if above, bullish.
01:47
What crossover triggers an entry signal?
Intersection of the 13 and 5 period SMAs.
02:11
What RSI condition confirms a sell trade?
RSI should be moving downward and in oversold condition (below 30% yellow line).
02:39
What RSI condition confirms a buy trade?
RSI should be moving upward and break above the 70% blue line (overbought).
03:58
What additional confirmation is needed after crossover?
A strong candlestick formation (e.g., consistency).
03:58
Three SMA + RSI Setup
Core of the strategy: combining multiple moving averages with RSI for high-probability trades.
00:01Trend Identification with 45 SMA
The 45 SMA acts as a trend filter, a key principle for avoiding counter-trend trades.
01:47Crossover Entry Trigger
The 5/13 SMA crossover provides a precise entry signal aligned with trend.
02:11RSI Confirmation
RSI direction and overbought/oversold levels add confluence, reducing false signals.
02:39[00:01] you how I make use of three moving average and one RSI to create a high probability strategy. So, I'm going to come over to the indicator section right here. So, I'm going to use three moving average and
[00:16] one RSI. So, the settings of my first moving average comes with a period of moving average comes with a period of five. Moving average, I'll be using SMA. Right here on the ST level, I'll be using green color. I'll be using it on
[00:29] two pixels. So when I'm done, I'll click on save. So the second moving average comes with the period of 45. The moving average still remains SMA. Right here on the star level, I'll be using a white color on four pixels. So when I'm done,
[00:45] I'll click on save. The third moving average comes with the period of 13. Moving average SMA right here on the style level. I'll be using a red color. I'll be using it on two pixels. So when I'm done, I'll click on save. Why my RSI
[01:02] indicator I set it to a period of five. The star level, I'll be using a white color on the main line and I'll be using it on two pixels. While the 70% section, I'll set it as blue color one pixels. 50% section I'll
[01:20] set it to be on a gray color one pixels. That's why the 30% section I'll set it to be on one pixels and I'll use yellow color. So when I'm done I'll click on save. So this strategy I use the normal Japanese candlestick
[01:35] 1 minute candle time frame and I'll be using 1 minute expiration time. So right using 1 minute expiration time. So right here I'll be taking my first trade
[01:47] right at this particular point. So one thing I always put into consideration is the trend and that is the reasons why I'm using
[01:59] the moving average line with 45 period tends to give me a clear direction of the market anytime the market is going towards a downside direction. So once my
[02:11] candlesticks are actually below this moving average line then I'll be looking out for the intersection of my two moving average line right at this particular point which come with the period of 13 and
[02:25] which come with the period of 13 and five. So once I get that I tends to look out for a very good candlestick formation then I actually place my trade. So my RSI also has to be giving me a very good
[02:39] confirmation of a downtrade opportunity. It has to be going towards a downside It has to be going towards a downside direction and that is how I actually take a trade. So basically I'm actually in a for right here guys. So right here
[02:54] in a for right here guys. So right here found another opportunity my chart right here is above this moving average line
[03:09] which will give me a very good confirmation for an up trade and also my average line intersect right at this particular point and I'm able to see a consistency of a
[03:24] candlestick right here. So the next thing I also see right at this thing I also see right at this particular level is my RSI indicator. It's actually going towards an upside direction. It actually breaks this blue
[03:37] line right here which actually give me very good confirmation that the buyers are pretty much ready to move the market towards an upside move the market towards an upside direction.
[03:58] and right at this particular point I also make my second win right here. So right here I'm also able to find an opportunity right here.
[04:13] average line intersects. I always make sure I find a very strong candlestick and also if I have to go for a sell trade, my candlestick has to be below
[04:27] give me a very good direction of the market. Not only that, my RSI indicator market. Not only that, my RSI indicator I also pay very much attention to should be in the oversold condition right here before I take a trade. And right here I
[04:42] actually make my third win right in the market. So right here I also find an opportunity. So I need to see it to be a strong candlestick.
[04:55] candlestick. So I'll be going for two position. intersect and also the candlesticks are actually
[05:08] here. My RSI I also pay attention right here. It has to be in the overbought condition. condition. So right here I have 30 seconds to go.
[05:37] right at this particular point. So this is how I always trade this strategy. If you find value on this strategy, you can subscribe to this channel so you miss any of our amazing videos. Guys, thank you for watching.
⚡ Saved you 0h 06m reading this? Transcribe any YouTube video for free — no signup needed.