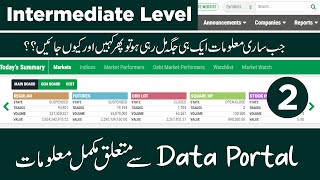

Data Portal Advanced Secrets Revealed
45sStarts with a promise of advanced knowledge, creating curiosity and high retention for viewers wanting to go beyond basics.
▶ Play Clip"The title accurately describes the content: an intermediate-level Urdu tutorial on the PSX Data Portal, part 2."
This video is the second part of a tutorial series on the PSX Data Portal, focusing on intermediate to advanced features. The presenter explains how to navigate market summaries, indices, stock performance, sector analysis, and historical data to make informed trading decisions.
The video is the second class on the PSX Data Portal, aimed at advanced users. It builds on the beginner-level content from the first video.
The market summary page shows three boards: Regular Board, GYM Board, and Debit Board. The Regular Board includes the regular market where shares are bought and sold, and it displays total trades, volume, and value.
The indices section shows various indices like KSE-100 and KSE-30. The market status indicates whether the market is up or down (green/red). The previous close and current index value are displayed, along with the change in points.
Market performance is divided into three sections: top active stocks (highest volume), top advancers (highest percentage gain), and top decliners (highest percentage loss). Examples include SCHOOL with 41 million shares traded and UCAP with a 16% loss.
Users can create a watchlist of up to five favorite scripts. The watchlist displays current price, percentage change, range, and circuit breaker status for each selected stock.
The market watch option allows viewing all traded shares in the regular and future markets. Users can sort by volume, price, change, and other parameters. The data updates every 5 minutes.
The trading panel shows the number of companies that performed positively, negatively, and unchanged. For example, 249 companies positive, 109 negative, 25 unchanged out of 373 traded.
Clicking on an index shows its constituents, index weight, and how each stock contributes to the index points. For example, N-Grow increased by 22 points with a 0.37% change.
The sector summary displays performance by sector, showing how many companies in each sector advanced, declined, or remained unchanged. For example, the automobile sector had 7 positive, 2 negative, and 2 unchanged.
The Big Less option is a powerful screener that allows filtering stocks by market capitalization, price, percentage change, dividend yield, free float, and 30-day average volume. Users can also filter by sector and index.
Users can view historical stock prices by selecting a company, month, and year. The data includes open, high, low, close, and change percentage. For example, TRG in July 2020 opened at ₹28 and closed at ₹96 on certain days.
By selecting a specific date, users can see all shares traded on that day, including their open, high, low, close, and volume. This helps in analyzing past market conditions.
The eligible scripts section lists scripts available for trading in the regular and future markets, including new IPOs. Users can view details like face value and ending year.
The graphical view shows the top ten sectors by volume, top ten symbols by volume, and market breadth (percentage of advancers vs decliners). For example, commercial banks were the most traded sector.
The daily reports option has been moved to the reports section. The presenter concludes that the data portal provides comprehensive information, eliminating the need to visit multiple sources.
The PSX Data Portal offers extensive tools for advanced traders, including market summaries, indices, performance metrics, historical data, and a powerful screener. Mastering these features enables informed investment decisions without relying on external sources.
What are the three boards in the Pakistan Stock Exchange?
Regular Board, GYM Board, and Debit Board.
01:39
How many companies performed positively, negatively, and unchanged in the trading panel example?
249 positive, 109 negative, 25 unchanged out of 373 traded.
12:09
What is the purpose of the Big Less feature?
It is a screener that allows filtering stocks by market capitalization, price, percentage change, dividend yield, free float, and 30-day average volume.
16:21
How can you view historical stock prices for a specific company?
Go to Market > History Data, enter the company name, select month and year, then click search.
21:47
What does the graphical view show?
Top ten sectors by volume, top ten symbols by volume, and market breadth (percentage of advancers vs decliners).
25:44
What is the index weight of a stock?
The percentage contribution of a stock to the index points, indicating its influence on the market.
14:26
Market Performance Sections
Explains how to identify top active, advancing, and declining stocks, which is crucial for day trading.
05:12Big Less Screener Capabilities
Demonstrates a powerful filtering tool that allows users to find stocks based on multiple criteria, saving time.
16:21Historical Data Access
Shows how to retrieve past stock prices, enabling backtesting and analysis of historical trends.
21:47Graphical Market Overview
Provides a visual summary of sector and symbol performance, aiding quick market assessment.
25:44[00:02] talked about data portal, today is our second class on data portal, in yesterday's class we told you everything in simple words that when you search any word here, then after that all the options that come up, we talked about them in detail
[00:16] and we made this half an hour video and shared it with you which is only for beginners, but if you want to learn at the advanced level, then this class, today's second Kalwa class, is of the advanced level in which we will tell you
[00:29] which technical things you can see here, so let's start, first of all we told you about searching here in the first class, so the told you about searching here in the first class, so the first option you have here is My
[00:42] here also you can create My Portfolio, but here we will not talk to you about portfolio because this video of mine is already available on this, the time when the portfolio option came to Pakistan on the first day, at that time
[00:56] I made and uploaded this video. If you want to see it, you can see it, it is not a masala because right now our topic is data portal, so we will try to explore all these general options, but today we will try to explore these market options, so if
[01:09] but today we will try to explore these market options, so if click on today summary, then this page which is open right now, you can see that this page opens again, this is your
[01:24] market summary for today, we will understand it a little, we will understand it quickly, there is no masala, so first of all, we three types of things in Pakistan Stock Exchange on which the work is happening, one is the
[01:39] board, one is our gym board and one is debit, so all the trading and whatever we are doing, you are doing, all of them are coming in the board, all the companies are listening, so you can see
[01:52] that if we look further in the board, then its also comes in different sections, as in the board First of all there is the regular market where you buy and sell shares, this happens in the regular market, so there is a string in it like it is telling that at this time the
[02:06] market is suspended, if it is open then it is written 'Open', so here you will see that today in the whole day it is telling that ₹120000 118 trades have been done in total, so if you see, here it is telling you that 20093 million volume has been generated for these trades,
[02:21] this is not from A, the number of shares that have been traded, then what is their value, you can see that it is becoming 10 billion, so friends, here there has been trading of million, 10 billion worth of trading has happened, in simple words if I tell you, then
[02:34] in simple words if I tell you, then trading of 29 crore 39 volumes has happened trading of 29 crore 39 volumes has happened and the 10 billion that is formed onwards, just add this, this is the first option, this is the second option of the future market also,
[02:47] how much trading has happened in the future market, then you have another value that those who buy one or two shares, then how much is there in it. It has happened, then there is scrub and these different types of it, Amen, we will not talk about it in much detail because this is
[03:00] not talk about it in much detail because this is not our top, if we come further, then we have index A, all these indices in Pakistan Stock Exchange are of different types of script type of companies, we
[03:12] will clarify that the shares are in 30, you can also be in one share, you will know about it later, so here first of all you will see, wherever
[03:27] you click on any stock, all these things will appear accordingly, you click on one hundred or click on 30, then this chart of yours, this high low appears accordingly, so you have to see all these things,
[03:43] Pakistan stock in different types of indices, so keep them only till here, this should be in the hands of our yelp, these are our indices So here, as I told you in the first video, what is written here is the market
[03:58] situation. It means how many points the market has gone up or down today. If it is green, it means the market is positive today. If it is red, How has it gone negative, this is the previous volume that is written for you.
[04:14] this is the previous volume that is written for you. Yesterday the market closed at 42265, so today the Yesterday the market closed at 42265, so today the market is at 42901, so it means that today the market has gone up by ₹635. If you add this to it, then this amount comes out, so
[04:27] add this to it, then this amount comes out, so compared to yesterday, the market has gone told you yesterday that how much money has been invested in the market today, how much volume has been generated today, and I also told you about the 1 year change yesterday,
[04:43] that ITD change, I told you about this in yesterday's video, I also told you about the range market's volume, and I will also tell you about this thing yesterday. The details were explained in yesterday's video. Now, wasting time on this is
[04:57] foolish. The next option we have is market performance. You can see it. In market performance, we have three sections. First, there are top active stocks, which you can see here. Then there is top advanced.
[05:12] This is one section. The third one is a designer. I'll explain it a little bit. So, designer. I'll explain it a little bit. So, stocks have seen the most trading today? Which have generated the highest volume?
[05:24] You can see that the highest volume has been generated in schools. 41 million shares were traded. in schools. 41 million shares were traded. Then, look at the bank that opened yesterday. 41 million million shares. It shows you the lines in which the most
[05:38] trading has taken place at the top. Then, those are the shares below that. And then these are the top advanced stocks. For the percentage, the ones that have given the highest volume today, for example, if you look at it,
[05:53] if you look at it, how much percentage has it generated today? 4% or 4%, which means that Yesterday, if a person had invested ₹1 lakh in it, then today he would have made a profit of 16000, which means his amount would have become 1 lakh 16000, so you can see that 86%,
[06:10] 86 paise, has been lost in it, as compared to yesterday, its price yesterday, so it is telling here, then this ₹1 has been lost in it, that much percentage is made in Sharia place, how much trading has happened in it, so these are
[06:24] I have made a video on them too, but I will share their link with you later, then these are top advances, in which the maximum loss has happened today, which Ashish is at the bottom for percentage, as if first of all you see in UCAP,
[06:41] although it is only 27 paise, but if you see, in percentage it becomes 1200 or 16%, suppose if a person had invested ₹1 lakh in it yesterday, then today he would have earned 88000, so this is from today, how much is this For percentage, from today onwards, the first thing that happens is the one in
[06:57] which the maximum loss has occurred. This section of yours is the debit market, we did not talk about it here also, yes sorry let's talk about Jim Board, sorry let's talk about Jim Board, in this your total is
[07:11] three companies registered, I am not able to see it anywhere here, well in this a total of three not registered, I do not know about this debit, that is why we will not talk about it, let's go down, so we will not talk about this section here also because if you
[07:27] something happens here, let's shoot this, I will show you this watch list what is the benefit of this, suppose here you have this search option here, suppose you write any of your
[07:41] favorite scripts here, what will be the benefit of this, whenever you open this page, it will be visible here that its price will be written, what is its price at this time, how much percentage change has there been, or what is its range, how many circuit breakers have been done The
[07:56] volume has been traded. Here you can write approximately five shares as per your requirement. I will put them here in simple words so that you get a little idea. You can also change them. Suppose
[08:10] these 3 minutes have been added here. You can remove any of them from here or whenever you open it again, these will be shown here. Next, we have this option to watch the market. There are two types of
[08:22] marks, regular market and future market. You can see both. You can see all the down. I will clear this option in a while. First, we go down. You will see here that you can see 25 written here. So this is your today. Here you can see
[08:36] So this is your today. Here you can see 25 and there are 300 shares which were traded today. All of them are being shown to you here. But first of all, what you have to do from here is select all from here. Now if you go
[08:48] down, you will see all these 30061 shares. Whatever is there, you will see it today and all these are visible to you in terms of volume, not this, the one which has seen the most trading is visible at the top, okay, school and then it is visible for volume,
[09:03] but you can change this also, how can you change it, first of all see from here, if you see Arunachal here, if you click once, you will see that first this sending order is shown i.e. 1 2 3, then for ABC, from today you will
[09:16] press this once then it will go into descending order according to s, similarly this is your DCP which was decided in the previous video or your last closing price, if you click on it then first it will start from zero and will go to the smallest, suppose
[09:31] that share whose price is between ₹3 to ₹5, then you can see from here, friend, this thing will also be shown in detail later, so from here also you can do sending and descending, from the open price to the high price You can see the low price, the current
[09:46] price, the percentage from today as well, that today the highest, the last, have been also you can see it like this and the percentage for money,
[10:03] so it is funny for you that there is ₹1 share, if it goes up even by 10 paise, then it goes up by 10%, if it goes up by 20 paise, then it goes up by 20%, so we have to see the percentage, so
[10:17] you see this share is coming in the order, in which the maximum loss has happened, similarly these are those shares, in the same way, while doing red, this red of yours will go to zero and then it will turn doing red, this red of yours will go to zero and then it will turn green and then it will keep going green, so
[10:30] if you descend this, then it will come in descending order, now one special thing here is that from here you can see the value of any set of 300 or 61 companies, if you want to see it in any one sector, like As soon as you see fertilizer, you
[10:43] select it from here, so now you have only that company, you can see it. From here, if we check automobile similar, then you will see that this company has been added to you. From here, you can select any other. And from here, if
[10:59] you come down and you want to see a particular index, like you have all these indices, then from here, which company is in which index, if you want to see that, then you will do like this, then the same 1100 companies will come to you here, which are in kc100, out of which
[11:13] 95 have come, in which trading has taken place. So, if we look at such Jackie such 30 from here, then you will know from here that in such 30 also, if you see that this target has been there in that too, it was there in that too. Well, we are going to see this thing also in future, but the
[11:28] purpose of telling you here was that from here you can see what yours is, for any sector, you can do this from today also and you can
[11:40] How can we check this? Suppose we have the limited sector and the cement sector here, then these three companies will come up. If we look at the KSC in the cement sector, you will also know how many companies are there. Similarly, you can check the companies by sector and index to see
[11:55] Similarly, you can check the companies by sector and index to see which was the first option. After that, we have the trading panel. When you click on the trading panel, another panel appears to you.
[12:09] On YouTube, I am also telling you how many companies performed positively and how many negatively in the Pakistan Stock Exchange today. I am will see that here you will see this written, first of all, you should see that today 249 companies have
[12:26] performed positively, 109 companies have performed negatively, there has been no change in 25 companies performed negatively, there has been no change in 25 companies and there are 373 companies in which total trading has taken place. So, how much was there in Qawwali today, how much is this exchange, this thing has come up.
[12:39] Then if you want to see the regular market from here, then this one which The thing you are seeing is regular suspended trading volume, you have selected it from here, so this was the
[12:51] same thing that I told you from here that we were seeing here, this one, sorry, this one, if you see that this data was the same data, then you can see it from here, it was in the form of a pen, from here all shares, see it,
[13:05] you can see all of them from here, then if you want to see from here, can see all of them from here, then if you want to see from here, it has gone to your regular market from below 100 more shares are coming below here, but there is a little change here, let me
[13:18] tell you which change is that here it is telling you how much feed volume is there right now, how much is the price, the last thing it is telling, but I told you yesterday also that this data gets updated after 5 minutes, hence it is
[13:31] not necessary to see it, you have to see from your panel, how much is the offer, this percentage also and this data, we have to use only this option, there is no other option. In the next option, we will see which one gives us profit, the rest is also that if the
[13:46] next option is your intake, it is simple, all the indices are shown here, you can see which index has applied how much oil today and how much it has gone up and how much it is now, what percentage it has increased, you can check this thing here
[14:00] also, I told you here that your I low volume, this thing was also visible here, but now if you
[14:12] click on it here, then the same thing is visible to you here, but a little change has been done in it, if you see here, as you can see that such as 100, then it is telling you which change is there, in this its index weight is also telling
[14:26] how much percentage is its index weight, which I used to tell you a lot that if the weight of whichever company you have is more, it is a little more, if it falls down then it brings down the market, from here if we see that at this time and
[14:41] grow If you look at the stock of N Grow today, there has been a change in the money in the stock, so it has increased its points with the market, whereas if you see in this, there has been a change of ₹5 and it has increased by 22 points. If you look at the percentage, then it has gone
[14:57] up by only 0.37% or it has gone up by only one percent, so the points increase by joining, like see, only 2.1 and 35 points have gone up due to this, so this thing happens for the index points from today, then
[15:11] you can also see the free upload in volume from here, the already told you from where you can see the details of any stock,
[15:25] thing we have to see is the sector summary, if we click on the sector summary, then you will see that the option which we have is like this
[15:40] we have the sector summary, it is also telling us in the sector Suppose you look at the automobile sector, it is telling you that today seven companies performed positively, two of them performed negatively and there was no change in two. So,
[15:57] but there were 10 companies which performed positively and negatively for five days, there was no change in one, sorry, out of 10, 10 performed positively and are about to reach negative or in one, so now you should also get good news. Even in any sector, it is not necessary that
[16:09] all its companies perform positively, all of them with details, sector wise. Well, the next option is very
[16:21] special, there is the option of big less. Let's look at it a little, then you will see what this then you will see what this thing is.
[16:33] in this, you can see different things of each thing as per your convenience. You will get to see those things from here which you are not able to get even from the website room. Here, first look below, then I will tell you a little about the options above.
[16:47] I mean, here you are seeing the script and it is visible what is the market capitalization of RCR, what is its price, how much has changed in it and how much has changed in it in one year, this is also a special thing that
[17:00] if you look from here, from here you are seeing these shares which are 100%, you see, whose price has fallen by 50%, 70%, so
[17:12] if you look from here, there are many shares which have gone up by 17 super sets, which have gone up by 17 super sets, 17-17 super sets, that means if I give you this example that if a person had invested ₹1 lakh here a year ago, then
[17:25] today he would have 17 lakhs, these are those shares, they have gone up by 15 sets, you see, they are up by 450%, so this question's share is also there, you can see this thing from here, then five people say that you have to look at the P ratio, you can also see this standing of shares from here
[17:40] By descending, you can see from here how much the share is worth. Then the most important thing is that those who see which share gives the highest dividend. And for the year from today, you will see different shares visible here. As
[17:55] shares visible here. As you will see tomorrow, this one has a 75% dividend yield, which means if someone had invested ₹1 lakh in it, then it gave you ₹40,000 in just one year. The share there is the same. Similarly,
[18:08] share there is the same. Similarly, if you look at EPQL, if the value of this share was ₹1 lakh a year ago, then if he had invested ₹1 lakh, he would have got ₹65,000 in just one TV unit. This is your dividend yield. There are free floor
[18:21] your dividend yield. There are free floor chairs. And then your 30-day average, the average volume generated in 30 days, whatever that is, is being trading takes place in it or not. If so, you could use all these options above. Let me
[18:37] you could use all these options above. Let me market capitalization, the further you go, the more keep it here, up to 50 billion, we only need shares with market
[18:51] capitalizations above 50 billion. You'll see that out of the 3,657 companies that you have, only 36 companies are left with market capitalizations of this size.
[19:04] If we take it to 82, you'll see that these companies are the only 20 companies left with capitalizations of more than 80 billion. You
[19:17] then you can adjust the price, see the percentage, and then you percentage, and then you can adjust it back and forth.
[19:31] we need companies that have paid at least 50% dividend annually, so you'll see. You can say that it has come to you only from here, these four companies, okay, if I move this a little back, then you will see
[19:47] little back, then you will see where it has gone, sorry, 11 components, you can move this up and down,
[20:00] then the next share we have is the floating share, the free flat which is its share, you can move this also forward or backward, friend, it is 9 million, 10 million, you will do it from here, we will do it from here, right now the running time is in million,
[20:14] we will do it from here, right now the running time is in million, these billion and one billion ones, so you have one billion If the lien shares are added then in the same way you can move the percentage also forward or backward. Yes, one special thing in this is that right now you are seeing
[20:28] 657 companies here, we have backed everything up, right now we want to show us only the chemical companies, so now you will see that it is showing you only 25 chemical companies, now if you move it up and down, then what will it do in these, it will do
[20:44] sending, descending and sorting, but if you do the same in chemicals from here, then first of all you will know that there are five companies in it, from here you can do sorting as per your wish and see, well the next option
[20:58] we have is very special because the question of you people is that sir how do we know what is the value of sticker data, as you can see, there is a share app, as we are seeing from here, from here we do it, suppose we do it,
[21:15] seeing from here, from here we do it, suppose we do it, paise, let's see it from here, see it from here, today this oil price was 18 rupees 74 paise and
[21:29] red went up to 18 rupees 25 paise, if a question arises in our mind that how much was it worth on such and such date last year or the previous year's date, as suppose I want to see what was the share price on the old date last year, then
[21:47] how do I see that, brother, its simple way is that you have to come to market from here, you have to come to history data, so here you will write any company, like I will show you by writing TRG from here, then you will see it has been
[21:59] you will see it has been created with us, then from here we have to select which month it is, suppose it is the month of July and you and from here you will click on the search button, then the details of TRG for July 2020 will be displayed
[22:16] that how much was it worth on 1st July, how much It has opened at Rs. What has I placed on it, the low key is different, okay, and the speed of the close is, so you see, at that time speed of the close is, so you see, at that time it was ₹28, today it is ₹128, it is ₹128,
[22:29] well this is done, then how much does it come at on 2nd July, you can target this thing from any place, if you call today, it will show you the call data, sorry, the
[22:41] call has not been selected from here yet, it was necessary to select from here, so this came to us, necessary to select from here, so this came to us, you see, it was 96 the next day, so the
[22:54] close was good, the next day it opened at 9688, you get this thing from here, you get this thing from here, one more thing here, now you may have this question in your pocket that as we saw in the data portal, this was the first page that today's
[23:07] market situation was, which shares were at which prices, okay, as you have all these details below, which ones of today, now we have this question in your mind that we want to see which shares on the planned date
[23:22] You can also see at what prices it was. From here you can select any month, select June, select July, and we select 2020 and see if I have selected a holiday on July 10, 2020.
[23:38] Otherwise, if you do this and search from here, then all the shares will be displayed to you, which shares were at what prices on June 10, 2020,
[23:50] how much it moved, how much it turned red. You can see all these shares. First of all, one came at the top, someone was looking for the right share, for that, its training was the highest, then Yaar ji, then TRG June. In this, it is showing you a mix of both things, the
[24:05] regular market as well as the futures market. So you can see that the data you will get here is 500-19 increase meter, and everything, low high, open close, change percentage, everything, it is telling you this in detail. So
[24:21] these are two things and its love is now If you have so many things stored here and now all the data of one day is stored in it, but if you start searching from here, suppose you want to see the value in the date, then you write the value here, then
[24:35] in the date, then you write the value here, then you will have the value, the future contract number of the value will also be stored, secondly, everything will be stored immediately, you can see it, let's everything will be stored immediately, you can see it, let's move forward, the next option we
[24:47] have is eligible scripts, which scripts are in the market at this time, it can be gym trading,
[24:59] here when you do this, you have this market, regular market, first there is 786, 12 are at the top, then for this error, you will see all these, you will see here the data you are seeing is
[25:12] 25, above here we will have the option somewhere, light here is the maximum, so we show it and then you will see that this is increasing research for you ₹472, next by going to the next page you can see the regular market You
[25:27] IPOs of futures, you can see if there is a new IPO, the CS who called this thing, which is not our Mittal,
[25:44] you can also see this from here. Next, the next option we have is the Next, the next option we have is the graphical view. If we click on the graphical view, then this graphical view
[25:58] shows us the top ten sectors in today's trading, so if look here, the three sectors that you see most here are the most traded, first of all these are your commercial banks, when you click here,
[26:14] you will see that along with it, I am also showing you the volume above here, you can see it here also, you can see it here also, so there has been trading in this, after that there is your oil and gas and then after that technology and communication and hence RC
[26:27] graphical is telling you from today which sectors are in the market today, then Your top 10 symbols have increased, the most in them is school, then most in them is school, then bank came yesterday, GGL and all these and then in the same way
[26:40] it is telling the position of your simple, the same thing which we had seen earlier, that if we look at today for advance, then 80% of the companies were in advance today, yes there you could only see here that how many companies
[26:54] performed positively and how many negatively, so here for percentage, 80% of the companies here for percentage, 80% of the companies performed positively, 12% performed negatively, there has been no change in 1.22 and 96% of the companies are such
[27:08] that there has been zero of zero, there has been no change, so the last option we have in the market is of daily reports which has been removed from here and it has been converted further
[27:20] in your reports, here in the reports this option has gone, in downloads, they have removed it from here, which is our most useful option which tells you everything, the face value of a share, the ending year of a share,
[27:34] ending year of a share, we will tell you in tomorrow's video, this next option, these will not be there, only a few things are left, which will be
[27:51] and then you will not need to go to different places and giving us what, you will get everything from the data portal itself, so wherever you are, stay happy, keep me in your prayers, Insha Allah, we will meet in the next video,
[28:07] Insha Allah, we will meet in the next video, Allah Hafiz




⚡ Saved you 0h 28m reading this? Transcribe any YouTube video for free — no signup needed.