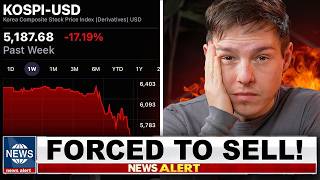

Korea's Stock Market Just Crashed 20% - America Next?
55sThe fastest and largest drop in Korea's history triggers fear that the same conditions exist in the US.
▶ Play Clip"Title implies an imminent U.S. crash, but video concludes it's unlikely, balancing both sides."
The video analyzes the recent crash in South Korea's stock market, which fell over 20% due to extreme concentration in two stocks, leveraged ETFs, and regulatory intervention. It then compares five similar conditions in the U.S. market, suggesting that while a Korea-like crash is unlikely, the risks of a significant correction are real. The video concludes with investment advice emphasizing diversification, emergency funds, and avoiding leverage.
Korea's KOSPI index had two stocks making up over 50% of the index, making it a concentrated bet on memory chips. The approval of 2x single stock leveraged ETFs led to 13.8 trillion won chasing a rally, triggering a crash after regulators warned about overheating.
The top 10 stocks make up 37% of the S&P 500, with Nvidia and Apple alone at 15%. While not as extreme as Korea's 50%, a 25% fall in those stocks could drop the S&P 500 by 9% before panic selling.
The Shiller CAPE ratio is 41, near the dot-com peak of 44. The Buffett indicator is at 219, more than two standard deviations above trend, indicating one of the most expensive markets ever.
Margin debt hit $1.5 trillion in June, meaning investors are borrowing money to buy stocks, amplifying both gains and losses.
Professional money managers hold only 3.6% cash, fully invested. Insiders are selling at the fastest pace in history, buying at half the normal rate.
Goldman Sachs raised its S&P 500 target to 8000, citing 24% earnings growth driven by AI. Blended earnings growth is near 25%, revenue growth 13%, and 88% of companies beat estimates.
The Russell 2000 is up 16% this year, and the equal-weight S&P 500 hit record highs, indicating broader participation beyond the top stocks.
If earnings fall 5% and P/E compresses to 16, the S&P 500 could drop 25% without a recession. Goldman's bear case sees 5400, Barclays 5900.
The five biggest hyperscalers are spending $1.57 for every dollar of operating cash flow through 2027, risking a pullback if AI growth slows.
The U.S. is unlikely to repeat Korea's crash due to structural differences, but a 20-40% decline is possible. Maintain a 3-6 month emergency fund, diversify globally, and avoid leverage.
While the U.S. market shares warning signs with Korea, structural differences make a repeat unlikely. However, investors should prepare for potential declines by staying diversified, holding cash, and avoiding leverage.
What percentage of Korea's KOSPI index did two stocks make up?
Over 50%.
01:49
What triggered the sell-off in Korea?
Regulators warned about leveraged ETFs overheating on June 22nd.
02:32
What is the Shiller CAPE ratio currently?
41, near the dot-com peak of 44.
04:31
What is the Buffett indicator reading?
219, more than two standard deviations above trend.
04:46
How much margin debt did Finra report in June?
Approximately $1.5 trillion.
04:58
What percentage of cash are professional money managers holding?
3.6%.
05:25
What is Goldman Sachs' year-end S&P 500 target?
8,000.
08:33
If earnings fall 5% and P/E compresses to 16, what is the estimated drop?
A 25% drop in the S&P 500.
13:38
How much are hyperscalers spending per dollar of operating cash flow?
$1.57.
14:09
What is the main investment advice given?
Maintain a 3-6 month emergency fund, diversify globally, and avoid leverage.
16:55
Korea's Extreme Concentration
Illustrates how a lack of diversification can cause a market crash.
01:49U.S. Valuation Extremes
Shows multiple metrics indicating the market is at historically high levels.
04:31Goldman Sachs Bull Case
Contrasts the bearish warning signs with optimistic earnings projections.
08:33Bear Case Stress Test
Demonstrates how even modest disappointments could lead to significant drops.
13:08Timeless Investment Advice
Reinforces the importance of liquidity and diversification in volatile markets.
16:55[00:01] market whatsoever, you're going to want to hear this. Believe it or not, Korea's stock market has just undergone the fastest and largest drop ever in history, having fallen more than 20% in the last few weeks. But, what's
[00:15] concerning is that many of those same conditions are showing up right here in the United States. For instance, we're seeing extreme concentration in just a few stocks, a massive rally being driven by AI, record amounts of retail
[00:29] leverage, and everybody piling into the same trade while the market is priced at its most expensive level since the dot-com bubble. So, that leads to the ultimate question. Was Korea an isolated crash, or was it a preview of what's
[00:42] to talk objectively about what's going on, what the data says is actually happening, if there's truly a concern here in the United States, especially with the search term market bubble now reaching its highest level since 2004,
[00:56] come out ahead. Because the goal is not to predict the exact day something breaks, it's to prepare yourself before it does. Well, before we start, I just want you to pay close attention to that like button. See it? It's unsmashed. So,
[01:11] I'll make you a deal. If you hit the like button and subscribe, I'll do my best to respond to your comment as many of them as I can. And as a thank you for doing that, here's a video of Bailey getting a treat. So, thanks so much, and
[01:23] also a big thank you to Incogni for sponsoring this video, but more on that happening with Korea's stock market, and why so many people are concerned that the United States could experience a similar fate, we need to talk about
[01:36] stock prices. Now, here's the thing. Just like we have the S&P 500 here in the United States, which covers the 500 largest publicly traded companies, Korea has what's called the KOSPI index, which for a while was one of the best
[01:49] However, here's where the problem started. Believe it or not, in Korea, started. Believe it or not, in Korea, just two stocks made up more than 50% of their entire stock market index, which basically meant that their diversified
[02:02] index of stocks was basically just a giant bet on memory chips, which leads to the next problem of leverage. See, earlier this year, Korea approved the product that had never really existed before, and that was a 2x single stock
[02:17] leveraged ETF. And in the first few months, 13.8 trillion won was chasing a rally that had already tripled. But then regulators stepped in. On June 22nd, Korea's top financial regulator publicly warned that the leveraged products had
[02:32] become dangerously overheated, and even said he wished he had blocked those ETFs from ever launching, which led to a frantic and dramatic sell-off, where chip stocks fell, but because they were leveraged, it forced margin calls,
[02:46] forcing even more sales, forcing the price to fall even further, forcing even more sales. The sell-off was basically so quick that regulators have now even banned single stock leveraged ETFs entirely and tripled the minimum deposit
[03:00] However, that's still not the entire picture, because Korea's crash required five ingredients: extreme concentration, a massive preceding rally, leveraged retail speculation, foreign selling, and doubts about AI. And when you go down
[03:15] that list, it is eerily similar to what we're experiencing today in the United States. So, how close are we to a similar setup? Well, to answer that, we need to talk about the AI bubble. As of right now, the S&P 500 is sitting around
[03:29] 7,400, which is about 8% higher than it was at the beginning of the year. So, on the surface, everything looks fine. But once you begin digging deeper, things get quite a bit interesting. With the first being number one, concentration.
[03:43] When it comes to this, the concern is that valuations are just growing so much that the largest 10 stocks now make up roughly 37% of the entire S&P 500. Nvidia and Apple alone are almost 15% and information technology as a sector
[03:59] Now, is that as bad as Korea's two stocks at 50%? No, it's not even close. But, you could still do the math. If those companies make up 37% of the index and they fall 25% that is a 9% drop in the S&P 500 before
[04:16] the panic selling even begins. Leading us to two, valuations. As of now, the S&P 500's forward price-to-earnings ratio is about 20.7, which compared to the 10-year average of 19 isn't crazy. But, the Shiller CAPE ratio is sitting
[04:31] at 41, almost matching the dot-com peak which topped out at 44. And the Buffett indicator, which measures total market value versus GDP, is sitting at 219, more than two standard deviations above trend. Or basically, in plain English,
[04:46] metric, this is one of the most expensive stock markets ever in history, which is crazy when you compare that to number three, leverage. Surprisingly, Finra just reported that margin debt hit
[04:58] approximately 1 and 1/2 trillion dollars in June. This means that investors aren't just buying stocks, they are borrowing money to be able to put it in the stock market. And when you compare this to Korea's leveraged ETFs, yes, the
[05:12] additional buying power certainly pushes prices higher when times are good, but it's also that much more brutal when prices eventually do fall. Taking us to fourth, sentiment. Now, what's crazy to me is that professional money managers
[05:25] are only holding about 3.6% of their portfolio in cash, which is basically all in on equities. So, positioning is kind of maxed out and nobody's hedged. And finally, fifth, we have insider selling. Believe it or not, right now,
[05:37] US insiders are selling stocks at the fastest pace in history and are buying at only half the amount they normally do. Of course, in fairness, insiders do could be hedging, taxes, diversification. Some of it's
[05:51] pre-planned in advance. They can't help it. So, it's not a smoking gun. But, when you combine that with everything else, including record-high valuations, either. That's why in order to understand what's most likely going to
[06:05] happen next based on the data, it's important to talk about where corporations are investing their own money. Because, while retail traders are basically yoloing it all into the markets, institutions are positioning
[06:17] themselves completely differently. And once you see where they're putting their money, it completely changes the entire picture. Although, before we go into that, there's another aspect to personal finance that almost no one talks about,
[06:29] most people think about protecting their money, they think about the obvious, secure, they're not taking on bad debt, and their spending's not out of control. But, here's the part that most people miss. Even if your accounts are secure,
[06:43] most likely your personal information's already floating around the internet in the hands of third parties, data brokers, scammers, or even random people your name, address, phone number, property records, way more information
[06:57] important to protect your personal information before it becomes a problem. And one of the best ways to do that is actually with our sponsor, Incogni. For those unaware, Incogni works by locating
[07:09] personal data, sending out legal requests to get them to remove these from databases, and then you get less of your data exposed. Or basically, instead of you emailing dozens of sketchy data brokers yourself, Incogni handles it all
[07:23] for you. They make sure the data brokers comply, and they follow up because a lot collecting your information even after Incogni's unlimited plan now allows you to submit custom links for removal. So,
[07:37] if you ever Google yourself and you find your information exposed on some shady website, all you have to do is copy and paste that link, send it to Incogni, and down for you. Plus, you can submit as many of these custom links as you want.
[07:51] personal data taken down, check out Incogni by going to incogni.com/graham and use the code Graham at checkout to get 60% off an annual plan. They're also available risk-free for 30 days, so anyone could try it out and give it a
[08:05] full refund if you're not completely satisfied. Again, that link is down Graham. Thank you so much, and now let's get back to the video. All right, so in markets, where the experts are investing their own money, and then what you can
[08:19] expect for the future, we need to talk about why we could be seeing parabolic gains. Yep, you heard me correctly. Despite record-high valuations, record-high margin debt, and a YOLO mentality, Goldman Sachs just raised
[08:33] their year-end S&P 500 target to 8,000, up from 7,600, which implies solid upside from where we are today. And here's the thing, their projections aren't just because stonks go up, it's because of earnings. In this case,
[08:48] they're projecting the S&P 500 to generate $340 a share this year, which works out to be 24% growth, all because AI infrastructure companies are rapidly expanding and are making money. Or in their words, "Earnings growth has
[09:03] return this year, and they expect that Stanley also believes 500 is going to rise this year, ending at 7,800. Citibank sees 7,700, and both JP Morgan and Wells Fargo see a relatively flat
[09:18] market for these next few months. But no major bank sees anything other than that. Worst case, it seems to be they think a flat market will probably go up a little bit, but nothing is going to collapse. Because so far, earnings this
[09:32] last quarter has been pretty good. In fact, blended earnings growth is now running near 25% revenue growth is near 13% 88% of companies are beating momentum to continue throughout the rest of the year. Compare that to the dot-com
[09:47] bubble where you had companies making no revenue, no possibility of revenue and they were trading at record valuations and they argue we're in an entirely objectively the stock market rally is actually broadening which is exactly
[10:02] what you'd want to see. Like the Russell 2000 small caps is up over 16% this year and the equal weight S&P 500 where every company is treated the exact same recently hit record highs. This means that we're no longer seeing the seven
[10:16] top companies carrying the entire index but rather smaller companies are beginning to participate and that's exactly what we'd want to see happening. also the demand side. Like corporate buybacks are already coming in at over
[10:30] 400 billion announced through late April up 20% from last year. Index funds see automatic inflows every other week from 401k accounts and credit markets are showing high yield spreads near historic tights meaning bond investors see almost
[10:44] no problem in the market whatsoever. Besides rising oil prices which could go down just as quickly as they go up. As far as AI fears being overblown just consider that if 95% of AI experiments fail the winners in cloud semiconductor
[11:00] and software are already monetizing. Hyperscale revenue is real and unlike the dot-com era the AI build out is funded primarily by profits not from junk debt and IPO money. A lot of the experts think that even if AI delivers
[11:15] modest productivity gains there's a chance that we might grow into our current valuations the same way that Amazon grew into its dot-com era price companies on Earth. Finally in terms of whether or not we are Korea the short
[11:29] version is that the United States stock market is structurally different. Our largest company makes up about 7% of the S&P 500. There's they had two companies making up 50%. Our market has the deepest, most diverse buyer pool in the
[11:44] world. We're talking pensions, funds, institutions, other countries, its own citizens. There's was primarily funded by leveraged ETFs within their own citizens who were betting on very specific companies that drove a lot of
[11:58] the market. And finally, our leveraged single stock ETFs do exist here in the United States, but they are a fraction of the overall market and don't make up anywhere close to what happened in Korea. However, I will say, just to be
[12:11] fair, every single one of my positive arguments has a very valid counter argument. And in terms of what the critics are saying and why the S&P 500 could fall even more than Korea, we need to talk about the bear case. Now,
[12:25] obviously, the bull case assumes that everything goes correctly, that there are no bumps along the way. But earlier this year, that very same Goldman Sachs published a scenario where an oil shock from the Iran conflict drags the S&P 500
[12:39] down to 5400. And surprisingly, the spread between their bull case and bear case was the widest range they've published since 2020, which is just a fancy way of saying that the range of outcomes right now is enormous. Separate
[12:53] from that, Barclays has mapped out a bear case near 5900, and the veteran of the most bullish people on the planet, recently raised his probability of a market meltdown to 35% citing the collision of the Iran oil shock with
[13:08] when you actually begin to stress test the bull case, holes start to appear with the first being, number one, really high earnings expectations. Remember, the bull case depends on 24% earnings growth actually happening. Everything is
[13:23] that we're going to see sustained double-digit revenue growth, continued margin expansion, successful AI monetization, no recession, and no spike in interest rates. But, here's the math that nobody wants to do if earnings just
[13:38] disappoint. Say they fall 5% and the price-to-earnings ratio compresses down to 16, which would be pretty normal. That is a 25% drop in the S&P 500 without a recession, without a catastrophe, without any panic selling.
[13:54] happening. They just need expectations to fall lower from where they are today, leading us to second, AI spending math. The five biggest hyperscalers are expected to increase capital expenditures by roughly 534 billion
[14:09] through 2027, while their operating cash flows only grow by about 340 billion. This means they're spending about $1.57 for every dollar they get back. And obviously, this can work if AI growth continues and they eventually scale up
[14:25] to these valuations. But, if it doesn't, that's something to keep in mind. Taking us to number three, the wealth gap. Yes, smaller companies are outperforming the healthy market. But, on more than half of the trading days, the S&P 500 has
[14:39] moved in the opposite direction of the majority of its own stocks. A level of divergence that we haven't quite seen since the year 2000. It's usually a sign that something is wrong, especially when you pair it with number four, leverage.
[14:53] The record $1.5 trillion worth of margin debt is fine until things start falling triggers more margin calls, which triggers even more panic and even more selling. Finally, we have five, cash reserves. Remember, money managers are
[15:08] reserves. Remember, money managers are 96% invested, so what's left to buy in? Credit spreads are at 2.7%, which means bond investors are being paid almost nothing for the risk. And oil is constantly back and forth above 90 to
[15:20] everything happening throughout the markets, the bear case is not that everything goes wrong. It's that market expectations go back to normal. And normal's still a long way down. So, in terms of what I'm actually doing about
[15:33] this and my own thoughts about everything going on, here's what you came for. In terms of whether or not the United States is going to pull a Korea, the honest answer is probably not. And here's why. At the end of the day,
[15:45] Korea's market had two companies making up over half the index. Ours has 10 companies making up 37%, which is high, historically dangerous even, but it's not two companies making up over half the market. Their crash was also
[15:59] accelerated by billions of dollars of leveraged ETFs that had to sell into every decline. Our leverage products do exist, but it only makes up a fraction of the market. We have decades worth of circuit breakers that are ready to step
[16:13] in, deep institutional buyers, and trillions of dollars of 401k inflows that automatically buy every other week, no matter what. Plus, their sell-off was triggered by their own public trash talking of the rally, which, I'll be
[16:27] we're going to see here. But, that doesn't also mean that we're 100% safe. Because the lesson here isn't avoid Korean stocks, it's that concentration plus leverage plus euphoria could lead to a pretty disastrous outcome extremely
[16:42] quickly. And even if you just own the index, a 20 to 40% decline is a tough pill to swallow, but it's not necessarily catastrophic if you're just able to hold through it and aren't forced to sell. So, in terms of what the
[16:55] typical person should actually do here, it's the same playbook as always. It's a 3-6 month emergency fund that you keep in cash at all times. It's to diversify across the United States, international markets, real estate, commodities, gold,
[17:09] maybe some alternative assets, and then it's to avoid leverage at all costs, market falls. You never want to be forced to sell something unless you absolutely need to. Now, beyond that though, maybe Goldman Sachs is right and
[17:24] the S&P 500 increases to 8,000. Maybe the bears are right and we see 5,400. I genuinely don't know. Nobody has any idea what's going to happen. But, one thing is so far historically true. A 20-year holding period in the S&P 500
[17:39] has so far never produced a negative result, which means if you just buy today and you hold for 20 years, the stats are pretty good that you're going that time frame. Really, at the end of the day, the market does not have to be
[17:52] have to crash for you to get a good deal. All you have to do is stay patient, keep buying in, and no matter what, hit the like button and subscribe with that said, thank you so much for watching and as always, if you want
[18:06] early access to videos like this as well as an extra video every single week that I don't post publicly, feel free to join the channel memberships. And in addition to that, I'm also reviewing member financial statements, which means you
[18:19] could send me your investments and your goals and all that sort of stuff and I my honest opinion on your portfolio. If that sounds good, feel free to join. All the information is in there. Thank you so much and until next time.



⚡ Saved you 0h 18m reading this? Transcribe any YouTube video for free — no signup needed.