

Market Crash: Bitcoin Hits $81k, NASDAQ Down 6%
41sViewers are captivated by real-time market crash numbers and the promise of deeper explanation.
▶ Play Clip"Delivers on the promise of explaining the crash and providing preparation advice, though some claims are speculative and fear-driven."
The video analyzes the ongoing market crash, attributing it to overvaluation in AI stocks, Federal Reserve policy uncertainty, and a cascading domino effect of fear-driven selling. The creator warns of a prolonged downturn and offers advice on preparing financially.
The creator previously predicted a 2-year market decay, now expanding on that analysis.
Nvidia's earnings report showed poor numbers, confirming overvaluation in AI tech stocks.
Major AI companies like Nvidia, OpenAI, and Oracle are inflating profits by investing in each other, creating a bubble.
Strong jobs report (120k new jobs) creates doubt about Fed rate cuts, causing market indecision.
Selling spreads from high-risk assets to global indices as news panic triggers retail selloffs.
Creator sold all positions in January based on overbought RSI signals and euphoria among non-investors.
Rich investors dumping collectibles at peak hype causes price spikes then gradual decline, mirroring broader markets.
Bitcoin made higher highs while RSI made lower highs, indicating weakening momentum and an impending reversal.
Government shutdown delayed non-farm payroll report by 43 days, creating Fed policy uncertainty.
Expects a 100-200 day selloff with bottom marked by extreme fear, then opportunity for bargain buying.
If already invested, ride out the storm and buy more at panic bottoms; if out, stay liquid.
Bitcoin weekly volume profile shows high volume at $19k; Ethereum target $1,500; Nasdaq to 20k; Gold to mid $3,000.
If Nvidia and other top 7 stocks fall, entire US indices could collapse as they represent 90% of value.
Avoid luxury spending, prepare for job losses, maintain a safety net for soft landing.
The creator believes the market is in the early stages of a prolonged downturn driven by AI overvaluation and Fed uncertainty, advising caution and preparation rather than panic selling.
What was the key evidence that Nvidia is overvalued according to the video?
Nvidia's earnings report showed poor numbers despite marketing claims of everything being fine.
00:41
How do AI companies inflate their profits through circular investments?
Nvidia invests $100B in OpenAI, OpenAI uses that to buy Nvidia GPUs, and then OpenAI does a $300B deal with Oracle, creating the illusion of massive profits.
03:42
What does RSI stand for and what did it indicate about Bitcoin?
Relative Strength Index; it showed weakening momentum (lower highs) while Bitcoin made higher highs, signaling an overbought condition.
06:02
Why did the delayed non-farm payroll report cause market uncertainty?
The Fed had already decided to cut rates, but the report (showing 120k jobs) contradicted the need for cuts, creating indecision.
08:04
What price target does the creator give for Bitcoin based on volume profile?
Around $19,000 based on the weekly chart's high volume node.
12:19
What percentage of US index value is concentrated in the Magnificent Seven?
90%.
13:29
Circular money flow among AI companies
Reveals a systemic risk where major tech companies appear profitable through circular investments, not real revenue.
01:10RSI divergence as early warning
Practical technical indicator that anyone can use to identify market tops before a crash.
06:02Prolonged downturn expectation
Contrasts with typical flash crashes, predicting a slow 100-200 day decline requiring patience.
10:29Practical preparation steps
Actionable advice for viewers to mitigate financial damage during the downturn.
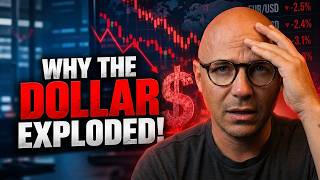
14:42[00:00] Bitcoin is free falling and hit a low of $81,000. Ethereum is also free falling and hit a low of $2,600. Yesterday, the NASDAQ dropped 6% and Nvidia had the largest single red candle that
[00:13] I've seen in years. On Tuesday, I made a 2-minute video on why I think the market is going to decay over the next 2 years. And you guys wanted in the comment section for me to do a 30 minute
[00:25] full explanation of this. So, let's get into it. And for those of you that don't want to stick around for 30 minutes, here's the TLDDR. Nvidia recently had their earnings report, and basically the marketing lingo of it was that everything's fine, but once the numbers actually came out, it
[00:41] just looked horrible. It proved to everybody that Nvidia and all of these AI tech stocks are crazy overvalued compared to their earnings. So, it just took a [ __ ] That was point number one. The
[00:54] second point ties into the first one and it is the fear that AI companies are overvalued just across the board and they're basically siphoning money through one another basically inflating their numbers. So as a quick gist, Nvidia borrows 100 million from the bank based on the share prices,
[01:10] then invests that 100 million into Amazon. Amazon then invests that 100 million into Oracle. Oracle then takes that 100 million and invests in Nvidia. All of them show plus 100 million on their books, but it's the same money. Point number three, the Federal Reserve decided to do rate cuts. And after
[01:26] they decided to do the rate cuts, then after the Fed decided to do rate cuts, the jobs reports came in and showed that there was over 100,000 new jobs. So people might think the Fed might delay the rate cuts now. Massive uncertainty in the Federal Reserve Bank and all of the reports.
[01:42] Next point. Since everything dropped five, six, 7% in one single day, all of the high volatility, higher risk assets like cryptocurrencies and other things in that genre like collectibles and
[01:55] high-end sports cars, everything else took a tank. Not only that, the European and Asian markets also sold off due to the economic downturn yesterday in the United States. tech, crypto, global indices,
[02:10] commodities, everything collapsed yesterday. This is a classic sign of the global population derisking, basically selling their assets because they see high volatility and high risk. So,
[02:23] they get out. The shitty thing about this is is that that getting out of all of that capital from the markets shows huge red candles. Then the fear-mongering starts with all of the local
[02:37] news channels, CNN, CNBC, they show the markets are painted red, everything's terrible. Then the general public who's invested in 401ks and doesn't monitor the market on a daily basis see
[02:50] that everything's going to [ __ ] and it creates this like social panic. So the original sell-off feeds the new sell-off of the general population because that's what the news is pushing now,
[03:02] creating a huge downturn. It's the domino effect. And I started seeing it in January. Markets were overleveraged, overbought. Everything to me was flashing overbought. There was excitement and
[03:16] euphoria in the general population. Taxi drivers were talking about the next big crypto hit. My dad was asking me if he should buy more Bitcoin and I was just like, "Nope, getting out of everything."
[03:28] And I started selling off everything starting in January. Look back at my videos. You can see all of the proof for all of the trades that I made. So, let's dive deeper into these topics, shall we? So, the number I gave you earlier was hundred million. It's actually hundred billion. In
[03:42] September, Nvidia agreed to invest up to hundred billion into OpenAI to finance a huge data center. In return for Nvidia's funding, OpenAI committed to purchasing and deploying millions of NVIDIA GPUs. So Nvidia gives a hundred billion dollars to OpenAI. Then OpenAI gives a hundred billion
[03:59] for GPUs to Nvidia. Yet they both show a profit of hundred billion. And then just weeks after the Nvidia pact, OpenAI struck another massive agreement, a $300 billion deal with Oracle.
[04:12] Then Oracle plans to spend around $40 billion to acquire roughly 400,000 of Nvidia's top tier chips. Do you see where I'm going with this? It's it's money laundering. If you were to
[04:25] actually break it down and see where the money's going, it's hopping from a bank to one company to another to another to another to another. All of the top seven companies, the Magnificent Seven, and they're all showing earnings report of massive profits, but they're not. This should be [ __ ]
[04:40] illegal, which is why all these fears about this AI bubble popping are actually real. And I think that we're going to see this significant downturn based on this [ __ ] Now, in Tuesday's video,
[04:53] I explained my early warning signs of why I thought the markets were expecting a downturn. I invest in high-end Pokémon cards. I saw a massive spike in the prices of these things and a steady
[05:08] downturn since that time. Now, let me explain this in a way that you guys can understand. If a rich person wants to get out of their high-risk assets, which they got at a low price, mind you,
[05:20] they take all of their Pokemon cards and they release them onto the market. And because there's so much hype at that time, everybody buys up all that supply, which causes the price to spike up
[05:33] rapidly because there are so many. When there's hype in the market and limited supply and then a huge chunk pops up, everybody grabs up what they can because they couldn't find it anywhere else before. So you get that spike and then it slowly starts trickling off because nobody
[05:50] wants to buy those cards anymore at that price. They are overpriced. They are overbought. Now, there's an indicator on Trading View called the RSI, the relative strength index, and
[06:02] it is basically a momentum indicator that shows you the overbought range and the oversold range. I'm going to show you some technical analysis how you can determine this overbought oversold
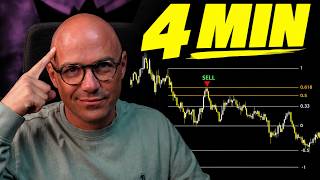
[06:14] range and when you think the markets should tend to reverse from an overbought standpoint. Okay, so this is a candlestick chart of Bitcoin on the daily time frame, meaning that every single one of these candles is one day long. This chart right here shows bullish market structure where we make
[06:31] higher highs and higher lows like a staircase pattern. Now, the thing that you want to focus on are these high points. Now, looking at all of these high points, you see positive bullish market
[06:43] structure. But if you look down on the RSI, the relative strength index, it shows a weakening of the momentum. We made higher highs and yet the RSI is making lower highs. When it's above the 7030
[06:58] range, the normal range, price tends to spike up dramatically. But after that happens a few times, the momentum gets lost. And once it starts trading back within the 7030 range, specifically like it
[07:11] did right here, we were making higher highs, but the RSI was showing a lower low within the range. That was my first early indication, and that's when I sold all of my Bitcoin. I got out at like
[07:24] 122,000. Since its all-time high, Bitcoin is now down 35%. These were the early warning signs that you should be able to find and spot and look for. When there's euphoria in the markets and your taxi
[07:38] drivers and your uncle Bill is telling you about crypto and stocks that you should invest in, you should get out as fast as you can. Moving on, it just gets worse and worse and worse. You guys
[07:51] are all aware that we had a government shutdown, right? That government shutdown prevents specific reports coming out at when they're supposed to. For example, NFP, non-farm payroll. These numbers
[08:04] always come out on the first Friday of every month. It's a huge news event and the market moves a lot during this news, but because of the government shutdown, it was massively delayed. And we just got the numbers. Now, CBS News says because of the delayed report that was supposed
[08:19] to come out in September, the US economy added 119,000 non-farm payroll jobs. Anything outside of the farming industry. Economists had expected 50,000 jobs. More than double actually showed up.
[08:33] Now, here's where the problem is. the Fed, the ones that determine what to do with the monetary supply in order to prevent crashes and panic and just red all over the streets, they decided that
[08:46] it's a good idea to cut interest rates because they said that the labor market isn't tight enough to sustain the inflation that we're having. And because that report was delayed 43 days, they didn't have the necessary information that they needed. So, they already said that they were
[09:01] going to do rate cuts and then they got the non-farm payroll information of 120,000 new jobs. Now, here's the mixed signals. Fed wants to cut rates. Jobs look good because there's indecision in the markets. Most major investors, financial institutions, and banks are like, "Cool,
[09:18] there's indecision. Let's GTFO." And so, that's why there's this massive sell-off happening right now. People don't like surprises. Banks don't like surprises. So with the uncertainty comes a monstrous sell-off and that's what leads to the domino effect. The massive sell-off shows massive
[09:34] red candles. Then the news starts reporting on it. The general public starts seeing these crazy downturns in the market. They start panicking. They start selling off. And it just becomes this cascading selloff that's nonstop red. And when the waters are murky with blood, who comes out
[09:50] to take advantage of it? those same banks, same financial institutions, same hedge funds that have an incredible amount of liquidity because they sold at the top of the market while the general
[10:03] populations and consumers get out mid crash. The big boys wait for all the turmoil to stop, all the panic and massive volatility and massive volume spikes to stop and slow down. and they're
[10:17] waiting at the bottom of the market, the bottom of the crash with billions of dollars of liquid assets that they can just buy up for way cheap. And this isn't the end of it. This is just the
[10:29] beginning. Once everybody starts freaking out, we will see a monstrous sell-off over the next 100 to 200 days. And once people start saying that we're in a great depression and we're expecting
[10:42] the next great recession, when fear and panic and mayhem is at an all-time high, that's when you know the market bottom is in effect. That's when you should be deploying your saved capital,
[10:56] investing in the markets like the big boys do to ride the swing back up because it will rebound eventually. I don't know when it's going to happen, but it will. This is not one of those flash crashes that you normally see with big news events like the COVID pandemic. This is going
[11:11] to be a slow cascading downturn over the next year. 2026 is going to suck for everyone's 401k, their retirement funds. I feel sorry for anybody that's coming into retirement in the next year or
[11:25] two. I'm hoping that you guys took my advice in January. And if not, I'm hoping that you took my advice in June and July. If not, right now we're in the middle of the [ __ ] storm. If you've
[11:37] gotten in at around this price on any of the assets that you have, you might just be smarter to ride the wave out and then buy some more when everybody's fear, panic, blood in the streets type
[11:51] of situation. But right now to get out, I'd say it's a little bit too late. You know, Bitcoin went from $127,000 to $82,000. you kind of are in the middle of the of the downturn and it's kind of
[12:06] easy to see where price is going to go based on volume that's happened in the past. There's this indicator called the volume profile and on the daily time frame the most volume was right here.
[12:19] But if we go out to a higher time frame like the weekly chart, the highest volume was down here at 19,000. So over the next 200 days we might return down to this area. This is the area. This is like
[12:33] a fat buy zone for me. I will dump I will take a second mortgage on my house to buy in at this area. Ethereum's price target is around 1,500. The German 40, basically the equivalent of the
[12:46] US indices in Europe. It's probably going to drop down to 14. Maybe it might recover at 16. The NAS will probably drop down to 20. US30 is probably going to take a hit to like the 35 36 area. Gold
[13:01] has been overhyped forever. So, a return down to the mid 3000s is more than likely. And Nvidia and all these tech stocks, I think they might hit the biggest dump. And that's what I'm afraid of is
[13:15] that if Nvidia drops down to the point of control on the weekly time frame, which is around $20, that's really going to suck because the entire US market is propped up on these seven companies. So
[13:29] if Nvidia falls, Oracle falls, Amazon falls, Facebook falls, X falls, it all falls. By X, I mean like Tesla and Elon Musk and everything that he touches. 90% of the value of US indices
[13:45] is in these seven companies. And if they all tank, oh boy, oh boy. I'm liquid. I'm happy. I've been liquid since June. Anyway, this is I know it's a doom and gloom type of scenario, but that's
[14:01] basically what everything's showing. I just hope that the domino cascading downward effect isn't as harsh or it's more slowgoing because if it starts ramping up, it's not going to be pretty. A lot of
[14:14] people are going to lose jobs because inflation is causing manufacturers and job creators to lay off their employees. Those employees get laid off. Then defaults on loans increase.
[14:28] The banking sector takes a hit. It's so bad. it when it starts cascading, it's so bad, guys. So, I have my fingers crossed that, you know, people aren't hurting after all this is over. Uh,
[14:42] prepare for the worst and hope for the best type of scenario. You should be not spending money on luxury cars. You should not be, you know, taking trips to the mall dives or spending ridiculous
[14:55] amounts of money. You should be preparing for possible job losses, slowed economy, have a safety net. And this is what safety nets are for is for when things get bad, you have a
[15:08] soft landing. Anyway, uh if you guys enjoyed this video, drop a like. Let me know your thoughts or what you anticipate in the comment section. Can't wait to read them. I really I'm excited to see what you guys have to say about this. Enjoy your day. Hopefully it doesn't get any worse.


⚡ Saved you 0h 15m reading this? Transcribe any YouTube video for free — no signup needed.