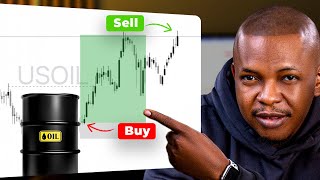

Oil spikes $50 in days!
50sThe dramatic price surge from $70 to $119 in response to geopolitical events is a compelling and easily digestible hook for viewers interested in markets.
▶ Play Clip"The title promises a trading opportunity and the video delivers a detailed technical analysis, though it includes a sponsor segment and some repetition."
The video analyzes the impact of the Iran-Israel-US conflict on crude oil prices, highlighting the strategic importance of the Strait of Hormuz. It provides a step-by-step guide on how to trade crude oil, focusing on technical analysis using concepts like break of structure, fair value gaps, and order blocks, with a live trade example.
The war tension involving Iran, Israel, and the US, and Iran's disruption of traffic through the Strait of Hormuz, a critical oil route, is causing oil prices to react fast.
Brent crude moved from about $70 to $119, and US oil from $60 to $119, driven initially by speculation, but the real supply-side effects are just beginning.
The two main types of crude oil are US oil (WTI, West Texas Intermediate) and UK oil (Brent crude), which is used to price a large share of world crude oil.
WTI may appear as US oil, WTI, XTIUSD, USOUSD, US crude, or CL. Brent may appear as UK oil, Brent, XBRUSD, UKOUSD, BRN, or BCO. On Bybit Trade 5, they are listed as USOUSD and UKOUSD.
US oil tends to be more aggressive and spiky, while UK oil is smoother. The presenter prefers UK oil as it reflects the global benchmark better and is easier for beginners to read.
The war created a big gap in the chart. The presenter focuses on a region for signs of a change of character to trade the chart lower.
On the 5-minute time frame, a change of character (CHoCH) formed after a series of spikes, indicating trading opportunities to trade the chart lower. Break of structure (BOS) points were identified.
Using Fibonacci retracement from the high of a break of structure to the low, an entry at 70.5 was identified. Two trade opportunities were found in one day, each with a risk-reward ratio of at least 3R.
Two winning trades at 3R each (6R) and one losing trade, resulting in a net profit of 5R.
The presenter is in a trade on the 1-hour chart. After a clean break of structure, there is a fair value gap (FVG) that has not been fully mitigated, with a demand zone below it. The target is the 15-minute supply zone.
The presenter waits for a change of character on the 15-minute or 5-minute timeframe. They enter after a 50% retracement from the low to the high, with a risk-reward ratio of 3.89.
The presenter plans to move the stop loss to break even if the trade moves above a high and retraces, then trail the trade upwards. They also mention that if the stop loss keeps getting hit, one should trade differently.
A big crash occurred due to a news candle from Trump's tweets on Truth Social, stating the US is suspending all military strikes. The presenter emphasizes the importance of proper trade management.
The video provides a practical guide to trading crude oil during geopolitical crises, emphasizing technical analysis and risk management. The presenter shares a specific trade setup and highlights the importance of adapting to news events.
What are the two main types of crude oil that can be traded?
US oil (WTI) and UK oil (Brent crude).
01:24
What does WTI stand for?
West Texas Intermediate.
01:36
What is the main US oil benchmark?
WTI (West Texas Intermediate).
01:36
What is the difference in price behavior between US oil and UK oil?
US oil tends to be more aggressive and spiky, while UK oil is usually smoother.
03:49
What is a 'change of character' (CHoCH) in trading?
A change of character is a price action signal indicating a potential reversal, often after a series of spikes or a break of structure.
05:19
What is a 'break of structure' (BOS) in trading?
A break of structure is when price breaks a previous high or low, indicating a potential continuation of the trend.
05:47
What is a 'fair value gap' (FVG) in trading?
A fair value gap is an imbalance in price that often gets filled or mitigated, providing potential entry or target zones.
08:56
What is the risk-reward ratio of the trade presented in the video?
The trade had a risk-reward ratio of 3.89.
12:52
What was the result of the two trades taken in one day?
Two winning trades at 3R each (6R) and one losing trade, resulting in a net profit of 5R.
07:20
Oil Price Spike
Shows the immediate market reaction to geopolitical events, providing a real-world example of supply-side shocks.
00:37Two Crude Oil Types
Clarifies the difference between WTI and Brent, essential knowledge for any oil trader.
01:24US vs UK Oil Behavior
Provides a practical comparison of price volatility, helping traders choose the right instrument.
03:49Change of Character
Explains a key technical concept that signals a potential trend reversal, crucial for entry timing.
05:19Trade Management
Emphasizes the importance of risk management, including moving stop loss to break-even and trailing.
13:06[00:02] the war tension involving Iran, Israel, and the US. And it could get worse because Iran has disrupted traffic through the Strait of Hormuz, one of the through the Strait of Hormuz, one of the most important oil routes in the world.
[00:21] trades passes through that route. So, when there's a problem there, oil reacts fast. If you look at the charts, you can already see the effects. When this war started, Brent crude moved from about $70
[00:37] straight to $119. And we can also see that from the US And we can also see that from the US oil, moving from around $60 to $119. Um dollars. Now, they both retraced after this particular move, as you will
[00:53] after this particular move, as you will see here. because this first spike we see here was driven by speculations. But, the real supply side effect of this war are just beginning to put price even higher. Now,
[01:09] rising oil prices are bad for global economy. But, for traders, it creates massive opportunity to profit. And today, I want to show you exactly how to today, I want to show you exactly how to trade crude oil step by step.
[01:24] To start, you need to know [music] that there are two main types of crude oil that you can trade. The first one is US oil, also called WTI, [music] which oil, also called WTI, [music] which stands for West Texas Intermediate. This
[01:36] is the main US oil benchmark. The second is UK oil, also called Brent crude. This >> [music] >> Brent oil comes from the North Sea, but
[01:48] it is used [music] to price large share of world crude oil, including much of the oil linked to Europe, Africa, and the Middle East. So, when people on the news talk about global oil prices, they are very often referring to Brent crude.
[02:05] Depending on your broker, this instrument may show up under different names. For the WTI crude oil, you might see US oil, WTI, [music] XTIUSD, USOUSD, US crude, and CL. For Brent
[02:20] USOUSD, US crude, and CL. For Brent crude, might see UK oil, Brent, XBRUSD, UKOUSD, BRN, and BCO. On Bybit Trade 5, where I personally trade, they are listed as USOUSD
[02:37] and UKOUSD. I'll leave the link in the description of this video. Now, one reason I like Bybit Trade 5 is simple. I can [music] trade everything in one app, forex, crypto, commodities, and even options,
[02:52] >> [music] >> I don't need to connect MT4 or MT5 just to execute trades. But, if you prefer MT4 or MT5, I'll also leave a safe, [music] of this video. Now, back to the real
[03:08] >> [music] >> US oil or UK oil? If you look at the similarly because they are both crude oil and both are reacting to the same major global effects. But, they do not move exactly the same way.
[03:24] So, after that spike that we see here for um UK oil, you will see in this axis that is actually going back to the top.
[03:36] While US oil, after that first major move, you will see here that it is not aggressively as going towards that top like the UK oil. If I go to a lower time frame,
[03:49] now, US oil tends to be more aggressive and more spiky. UK oil is usually more smoother. Personally, I prefer UK oil. It reflects the global benchmark better. The price action feels cleaner to me and lines [music] up better with my time
[04:04] zone and the trading section that I like. So, if you're a beginner, I think UK oil is usually the easier one to read. However, you can trade anyone you prefer. This is just my personal preference. Now, let's get to the chart
[04:20] proper. I want to show you the opportunities this war has created, the trade [music] I'm currently in, where I entered, and where my target to exit is. >> [music] >> So, I'm going to start looking from
[04:34] So, we had this very spike that left this big gap. Now, when I saw this gap, one thing was clear to me that this, of course, is >> [music] >> the only thing I have to look at is in
[04:50] this region for signs that it's going to start >> So, we're going to go to a lower time frame and zoom into this region to see brought. Okay, so currently I'm on the fifth on the 5-minute time frame,
[05:05] actually. Now, when I saw this open space taken [music] out, okay? So, because there's this trap not trending down, this form what we call a change of character did not happen until we got to this point because you can see
[05:19] that there closes that we have here are all more or closes that we have here are all more or less spikes. Okay? But, from here, it forms what we call a change of character. Okay? So, this tells us that
[05:32] from here is this [music] are trading opportunities to trade this chart lower to this particular point we have here. So, what are the opportunities that we have here? So, we keep on having break of structure here, here,
[05:47] here, and [music] here. Now, if you look at this, there was an opportunity have been a profitable trade because
[05:59] you've watched one of my videos, just right from here, if you draw a Fibonacci from this particular high that left this break of structure to this low, you will see an opportunity to enter at 705. So, that would have been a very good trade
[06:14] um that we have taken then. The next opportunity didn't come. So, we had a break of structure here. We now see a retracement to this zone. This would have been a place to short. Okay? So, no trade opportunity here. But
[06:27] break of structure here, and the same thing happened. >> If I take my Fibonacci, take it from the top of that break of structure and pull it down, this is this the other opportunity. So,
[06:39] this is another opportunity to have [music] taken this trade down. So, in [music] taken this trade down. So, in this particular move from here, once we get the change of character to this particular zone, we had two trade
[06:52] opportunities to have entered. And all this happened in one [music] day, as you So, two trade opportunities in one day. And this would give you a risk-reward ratio of not less than 3R. And this actually continues.
[07:06] This um is another break of structure here. course, this would have been a losing trade. So, two trades, two winning trades at 3R. This is 6R and a loss of one. So, I stay
[07:20] 5R in profit. [music] Now, we can continue from when we broke past this particular high we see here. Okay? When we broke past this high we structure, and this is the top that led to that particular break of structure.
[07:34] So, this here basically forms our top, and they Although we have a jump here and a gap here, this would have been my trade from the top here to this particular um trade. And you can see the chart did not retrace up to the
[07:48] to this point. But then, we had another one. We're now looking at this top. From this top, where do we have the next break of structure? We had it all the way to at this point.
[08:00] So, we had it all the way at this point, and for me as well. This is another trade opportunity in [music] this region. So, we can actually continue because
[08:13] opportunity to trade. Here is down here, [music] this is another opportunity to profit from this particular region. This will take us to where we are we currently are. So, I'm
[08:28] frame now [music] and just zoom into this zone to tell you guys the trade I am currently in [music] right here. So, let's look at this. I'm going to remove this. So, here, we're been moving higher, and this point
[08:43] gives us [music] a break a clean break of structure that I can clearly see here. Um BOS. And after this break of structure, you will clearly see that we have a fair
[08:56] value gap at this point [music] that has not been fully mitigated on the 1-hour. Below the fair value gap is an order block. That is a one a 1-hour demand block. That is a one a 1-hour demand zone, rather.
[09:13] have this particular chart tap into this region, once price tap I just have to look for a confirmation to go higher. Where will my target be? My first target is this point because I
[09:26] feel that we're going to take it out. Um there are multiple targets when we one target here. Another one is actually this one,
[09:38] forward to see this taken off. Now, because we have tapped into this zone, I don't just enter here. I have to go to 15-minute time frame or even 5-minute time frame to look for my confirmation. Now, this is where made this trade. I
[09:52] made this this trade or this [music] um price action when it was here. And what I did was to mark out this region. From this top, mark it this way. Why did I mark it because
[10:06] Why did I mark it because here Okay? It works in the in under 15 minutes, but >> [music] >> To make it clear. So, here we have a
[10:18] break of structure to the downside here. Okay? Yeah, so this makes it quite clear. What do you mean by structure So, we have this coming down this way, made this, came down [music] high.
[10:32] So, you will notice here that this high here is the high that led to this particular low. So, this is the high [music] that we need to break. So, I was just waiting. Once this was
[10:46] broken, this becomes my change of character. And when I see a change of is to enter immediately, and one is to wait for [music] a 50% retracement. So, taking it from this low here to this high.
[11:02] Okay? This is my 50% retracement. So, two taken this [music] trade. And before then, if you look over here, this is a supply zone. I'll I'll show you better on the 15
[11:16] minutes. Here is a 15-minutes supply zone. Okay, so this will be my first target because we can see a reversal from this I'll go ahead and mark it as my 15-minutes [music]
[11:30] um supply zone. Okay, this is like the target I'm looking forward first. The the lower zone of this particular zone. How do you take this trade? So, 50% retracement is 0.5 after change of character, you simply take your long
[11:44] position to This is actually where I got into this particular trade. And [music] uh you can target this bottom, but my target was here because I don't see it moving past this particular
[11:56] And the target is here. This top. ratio of of of 3.89.
[12:11] [music] simply doing this one. Doing this again, um taking the long position after you see a change of character. long position. Target [music] this bottom as well.
[12:26] And take it all the way to this particular point. Now, this is giving a 1.74 risk to reward ratio, so I will not take up to three, uh I won't take it. So, naturally, if I
[12:39] see this, I will naturally pull this down So, this is where I would have entered. [music] Okay, if I was doing this. But I actually got in at around this
[12:52] three um points um three points 89 risk [music] to reward. Now, so how manage this trade? What I'm expecting is this.
[13:06] This is a high. So, if this trade moves above this high, >> retraces, and moves again to break this high, I will now move This is the call my protected low.
[13:20] I can now move to break even. So, I'm going to trade [music] trail this trade upwards as the trade moves on. An aggressive trading where I get into this particular point because um this is normally if I get a risk to reward ratio
[13:32] of three, I am good, but this is giving even much more than that. So, this trade that there can be still more opportunities if you have a retracement >> and they push forward more because because they have more to pull
[13:45] um entries [music] before um this trade runs out. And that is how I look at trading crude oil right now. You're seeing my entry uh where I where price
[13:57] is going to and how to trade it on Bybit. Now, Bybit. Now, if you continuously experience this, your stop loss keeps getting hit before price finally moves in your direction,
[14:11] you need to trade a different way. This is an update on >> [music] >> um in this video. So, took the trade, and on Monday we saw a very big crash from this
[14:25] still good because uh we are two hour into this particular trade before we saw that crash. Why did this happen? This is a news [music] candle, and this happened because of the of the tweets that Trump dropped on
[14:40] Truth Social. He basically said that the US is suspending all military strike days. So, you can see the market reacts sharply to it. That's why we have this particular drop. So, it's important that when you trade oil or any other assets
[14:54] that matter, you should always manage your trade properly. In this video here, I explain how to trade options step by step. This is a solution to your
[15:07] stop loss problem. So, click here to watch it.
⚡ Saved you 0h 15m reading this? Transcribe any YouTube video for free — no signup needed.