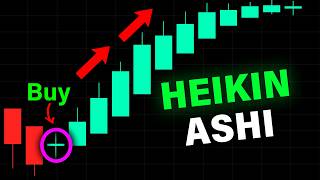

Why 99% of traders use Heikin Ashi wrong
43sChallenges a common trading practice with a bold claim, sparking curiosity and debate.
▶ Play Clip"Solid content with actionable strategies, but the 'BEST guide you'll ever find' is oversold; it's a good tutorial, not revolutionary."
This video provides a comprehensive guide to using the Heikin Ashi indicator for trading, emphasizing that most traders misuse it by treating it as a regular candlestick chart. The presenter explains the indicator's smoothing effect, demonstrates how to read its candle types, and introduces high-probability strategies that combine Heikin Ashi with key levels for more accurate entries and exits.
99% of traders use Heikin Ashi incorrectly by blindly entering trades based on candle color alone, which is the fastest way to blow up an account.
Heikin Ashi is an indicator that smooths out price action using a special averaging formula, providing a clearer view of market direction compared to regular candlesticks.
Heikin Ashi removes noise, showing all green candles in an uptrend and all red in a downtrend, making trends easier to read and reducing false signals.
On TradingView, click the chart icon, select Heikin Ashi to transform the chart. For a side-by-side view for free, use a custom indicator by a specific creator.
Heikin Ashi does not show real price; it's an indicator. Using it to measure price or backtest leads to misleading results. Always view real price side-by-side.
Three types: bullish (green with upper wick, signals uptrend), bearish (red with lower wick, signals downtrend), and doji (small body, equal wicks, signals indecision).
Strong uptrend (green candles, no lower wicks, growing bodies), weak uptrend (shrinking bodies, lower wicks), sideways (multiple dojis), strong downtrend (red candles, no upper wicks, growing bodies), weak downtrend (shrinking bodies, upper wicks).
Draw key levels on real price chart. Wait for price to revisit a level, then use Heikin Ashi to confirm momentum shift. Enter when candle body is small, set stop loss below/above level, take profit at 2x risk.
Instead of fully closing at take profit, close 50-80% and move stop loss to break even. Use Heikin Ashi to detect trend weakening (shrinking bodies, wicks) to exit remaining position.
Recommends BlowFin exchange for low fees and fast execution, offering up to $3,000 in bonuses for viewers using the link.
Identify trend lines (price rejected at least twice). Combine with Heikin Ashi confirmation (doji to green candles) for entry. Example shows buy setup at trend line with 2R target.
When multiple key levels align (e.g., trend line and flipped support/resistance), the probability of rejection increases. Use Heikin Ashi to confirm downtrend (red candles, no upper wicks) for sell entry.
Heikin Ashi is a powerful trend-filtering tool when used correctly, but it must be combined with price action and key levels for reliable entries. The key is to treat it as an indicator, not a price chart, and to manage trades actively using its signals.
What is the main purpose of the Heikin Ashi indicator?
To smooth out price action and provide a clearer view of the overall market direction.
00:55
What is the biggest mistake traders make with Heikin Ashi?
Treating it like a regular candlestick chart, which leads to misleading results because it doesn't show real price.
03:34
What are the three types of Heikin Ashi candles?
Bullish (green with upper wick), bearish (red with lower wick), and doji (small body with equal wicks).
04:40
What does a doji candle indicate?
Indecision in price, as neither buyers nor sellers are in control.
05:46
What are the five signals on a Heikin Ashi chart?
Strong uptrend, weak uptrend, sideways trend, strong downtrend, and weak downtrend.
06:13
How do you identify a strong uptrend on Heikin Ashi?
A set of bullish candles with no lower wicks and growing body sizes.
06:13
What is the ideal entry point in a strong trend according to the video?
When the candle body is still small, indicating the trend is early.
06:26
Why should key levels be drawn on the real price chart, not the Heikin Ashi chart?
Because key levels must be based on real price movement to stay accurate.
08:39
What is a confluence zone?
An area where multiple key levels converge, making it the strongest type of key level.
15:31
How can you manage a trade to maximize gains using Heikin Ashi?
Close 50-80% of the position at take profit, move stop loss to break even, and use Heikin Ashi to detect trend weakening to exit the rest.
11:17
The 99% Mistake
Highlights the common misuse of Heikin Ashi, setting the stage for the video's value.
00:02Heikin Ashi is Not Real Price
Crucial warning that prevents traders from making costly errors.
03:34Five Heikin Ashi Signals
Provides a systematic framework for reading the indicator.
06:13Key Levels + Heikin Ashi Strategy
Demonstrates a practical, high-probability trading method.
08:25Partial Profit Taking
Offers a risk management technique to maximize gains.
11:17[00:02] this is what it looks like when the hikenashi indicator is applied. When used correctly, this simple indicator can turn basic setups [music] into huge winning trades. But here's the problem. 99% of traders still use it completely
[00:16] wrong. Most traders will just blindly enter trades based on the color of the hiken ashi candles alone. When they see a green candle, they buy. When they see a red candle, they sell. But trading the hiken ashi like this is actually the
[00:29] fastest way to blow up your account because once you try it, you'll quickly find out that it doesn't work at all. However, after years of testing hundreds of systems, I found the best way to use this indicator, which to this day has
[00:41] winning trades in my career. So, in this video, I'll show you exactly how to use the Hiken Ashi indicator to get more accurate entries, filter out fake moves, and maximize your gains on every trade. Let's begin. First, what is the hiken
[00:55] ashi? Hiken ashi is an indicator designed to smooth out price and give us a much clearer view of the overall market direction. It looks almost like a candlestick but works slightly different. A regular candlestick forms
[01:08] based on the open, high, low, and close of each session. While the hiken ashi candle uses a special averaging formula which makes the price movement look smoother. Now, we don't need to dive too deep into the formula itself. But the
[01:21] and helps us read the trend more clearly. So, let's look at an example. Here we have a regular candlestick chart in a clear uptrend. But in this uptrend, candles forming along the way. These candles might confuse you into thinking
[01:37] that the trend won't last long. And if you're holding a buy position, it can make you panic sell early, causing you to miss the rest of the move. However, if we switch the same chart to a hike in Ashi, notice how all the candles remain
[01:49] green during the uptrend. This removes the noise and gives you a much cleaner view of the upwards move. Let's see another example. Here we have a regular candlestick. Price is on a downtrend, starts to move sideways, and eventually
[02:03] shifts into an uptrend. During this sideways movement, notice that price shows multiple red and green candles mixed together. Now, again, this could make it hard to tell where the trend is heading next. However, when we switch to
[02:15] a hike and ashi chart, we can now see that the transition between the downtrend to the uptrend looks much smoother, making it easier to anticipate the next move. And now, [music] I'm going to show you how to apply the hiken
[02:27] ashi indicator onto your charts. First, you'll need to use a charting platform. In this example, I'm using Trading View. Next, click the chart icon at the top Next, click the chart icon at the top right. Then, select Hiken Ashi.
[02:40] This transforms your regular chart into the hiken ashi chart. Now before I talk about the biggest mistake I see traders make when using this indicator. lead to painful losses. So make sure that you avoid it. But before I reveal
[02:56] it, I just want to give a quick reminder that every single day I post daily market analysis and trade setups completely for free inside my Telegram community. For example, I recently shared a setup on Binancecoin or BNB,
[03:09] telling members that it could go up and just 2 days later, it shot up almost 8% from that analysis. So, if you want to learn how a professional trader breaks down the market daily, make sure to join my free Telegram community. The link is
[03:21] in the description. Now, back to the video. So, the biggest mistake traders make is treating the hiken ashi like a regular candlestick chart. Remember, a regular candlestick does show us the real price, but the hiken ashi doesn't
[03:34] show it at all. So, never treat it like a regular candlestick. [music] Let me show you why. In this example, we can see a large hiken ashi candle. At first glance, it may seem like the price is pushing up strongly with big momentum.
[03:47] a regular candlestick chart, notice that the actual price had barely moved at all. This is why the hiken ashi should be treated only as an indicator. Avoid using it to measure price or to back test any strategies because it will lead
[04:01] to misleading results. That's why when trading the hiken ashi, I like to have a sidebyside chart view like this. So I can see both the real price and the hyenashi at the same time. However, this sidebyside chart feature is only
[04:14] available in the paid version of trading view. But the good news is I actually know how to do it for free. All you need to do is head over to the indicator section on Trading View, type in Hiken Ashi and choose the one by this creator.
[04:27] Once applied, this allows you to display both the hiken ashi candles and the real price using the free version of trading view. So [music] now that the basics are covered, we can now move on to how to actually read hyenashi candles and use
[04:40] them in your trades. First of all, reading the hiken ashi chart is actually very simple and straightforward. We can classify the hiken ashi candles into three main types. The first type is a bullish candle. A bullish candle is
[04:53] displayed as a green candle with an upper wick. [music] In a bullish candle, the lower wick can be short or even none at all. This type of candle signals that price is in an uptrend. The size of the candle's body can also measure how
[05:06] strong the trend is. A green candle with a big body means it's a strong uptrend, while a green candle with a small body means it's a weak uptrend. The second type is a bearish candle. A bearish candle is displayed as a red candle with
[05:19] a lower wick. In a bearish candle, the upper wick can be short or even none at all. This type of candle signals that price is in a downtrend. The size of the candle's body also measures the strength of the trend. A red candle with a big
[05:33] body means it's a strong downtrend, while a red candle with a small body means it's a weak downtrend. The third type is the dogee candle. A dogey candle can appear as either green or red, but the key characteristic is that it has a
[05:46] small body and wicks on both sides that are almost equal in length. This type of candle shows an indecision in price as neither buyers or sellers were in control. When a dogey candle forms on an existing trend, it could be a sign that
[05:59] sideways move or reversal could form next. And so based on these three candle types, they form five powerful signals on the hikenashi chart. And understanding these signals will be crucial for learning the strategy later
[06:13] on. Number one, strong uptrend. In a strong uptrend, you'll see a set of bullish candles with no lower wicks. The body of each candle also grows larger in size, showing that the uptrend is gaining momentum. A strong uptrend shows
[06:26] running, it's best to hold it as the trend hasn't yet shown signs of slowing down. But remember, the ideal entry is actually during the early stage of the trend when the body is still small. Avoid buying near the top as most of the
[06:39] upwards move has already played out. I'll explain how to do this later in the strategies part. Number two, weak uptrend. In a weak uptrend, the body of the green candle starts to shrink in size. Usually, we might see lower wicks
[06:52] begin to appear. This signals that the uptrend is starting to lose strength and reverse soon. During this time, you should be ready to exit your buy trades. Number three, sideways trend. In a sideways trend, you'll often see several
[07:06] dogee candles forming one after another. A single dogee candle might just signal a pause or a momentum loss of an existing trend. But when multiple dogee that the market is consolidating or ranging without a clear direction. I'll
[07:19] explain how to take advantage of ranging markets like this later in the video. Number four, strong downtrend. In a strong downtrend, we have a set of bearish candles with no upper wicks. The body of each candle starts to grow
[07:32] larger in size, showing that the downtrend is gaining momentum. A strong a sell position running, it's best to hold it as the trend hasn't shown signs of slowing down yet. But remember, the ideal entry is when the candle body is
[07:45] still small as there's more potential downside move. Avoid opening sell entries on large candles because most of the move has likely played out. Again, I'll show you how to catch early entries like this later in the strategies part.
[07:57] Number five, weak downtrend. In a weak downtrend, the body of the candle starts to shrink in size. [music] You might also see upper wicks begin to form. This strength and that price could soon reverse or move sideways. During this
[08:12] time, you should be ready to exit your sell trades. So, now that you understand move on to the high probability strategies you can use with it. And trust me, once you learn these, you'll immediately start getting more accurate
[08:25] entries on your trades. So pay close attention. Strategy number one. One of the most effective ways to use the hiken ashi is by combining it with key levels. Key levels are areas where price tends to react from. Examples of key levels
[08:39] are support resistance, trend lines, and confluence zones, which is where multiple key levels converge. Now, when trading this strategy, it's very important to draw these levels on the real price chart, not on the hyenashi
[08:52] chart. That's because key levels must be based on the real price movement to stay accurate. So, here's how we're going to trade this setup. The first step is easiest way to do that is to look for a level where price has clearly rejected
[09:05] before. So, whenever you see the price move towards a level and then move away from it significantly like this, that's a valid key level. So, we can mark it using a rectangle. In this example, it's called a resistance because the
[09:18] rejection is on top. Same thing with the opposite. Whenever we see price move down towards a level and then moved away from it significantly, that's called a support because the rejection is on the bottom. So once a key level is
[09:31] identified, the next step is to wait for price to revisit that same key level like this. Now since price has bounced off this level in the past, there's a due to the buying pressure on this support zone, which means we can
[09:45] potentially look for a buy setup here. But of course, we can't just enter chance that the support level doesn't hold and price might break through it instead. So, how do we know if price is likely going to break or bounce? This is
[09:58] where the hyenashi comes into play. Once we've found our potential trade setup, we move to step three, which is using the hikenashi for confirmation. So, let's apply it side by side with the regular chart. Now, the key here is to
[10:12] watch how the hiken ashi candles react when price is at this support level. Here the candles are still colored red with large bodies and no upper wick which means the downtrend is still strong. So it's better to avoid buying.
[10:24] after a few more candles formed, we can in size while upper wicks begin to appear. This shows that the downwards momentum is getting weaker. After that, the candles started turning green and we
[10:38] can see one without a lower wick. This further confirms that the momentum has shifted from a downtrend into an uptrend. Now remember what I said enter a trade when the hikenashi candle's body is still small because it
[10:51] shows that the trend is still early. And that's exactly what we're seeing here. So now we have the hikenashi confirming a potential trend change while the price is at support. Which means we can now move on to the final step which is the
[11:03] entry. For our entry we can place a buy position at the current price. set our stop loss at slightly below the support level and set our take-profit at two times the size of the stop- loss. And as you can see, price moved up and hits the
[11:17] take-profit target. Now, this trade was good and all, but there's actually a your potential gains from this trade. Here's how. Instead of fully closing the trade on this take-profit level, you can instead close it partially around 50 to
[11:31] 80% of your total position size. This is done to secure profits while keeping some positions open for more potential upside. For the remaining positions, simply move your stop-loss to break even. This way, if the trend continues,
[11:45] the remaining position will keep generating gains without any risk. To do this more effectively, we can actually use the hike and Ashi. Looking at the indicator once more, we want to watch how the candles react as
[11:57] our trade is running. Right now, the candles are still green, have large bodies, and no lower wick. This shows that the uptrend is still strong. So, we can still let the trade run. But here we can now see that the green candle's body
[12:10] starts to shrink in size. Lower wicks begin to appear and a red candle formed. This tells us that the uptrend has likely lost its strength, which means we can fully close the remaining of our trade here. So, notice that by using
[12:23] of your positions run with the help of the hyenashi, we were able to capture more of this upside move. So you can see just how powerful the hikenashi indicator is. But when using strategies like this, the platform you're trading
[12:37] on also matters a lot. Trading on an exchange with high fees or slow gains. That's why if you're looking for the best trading platform, I really recommend using BlowFin. They're one of the top crypto exchanges out there. And
[12:50] right now, they're giving an exclusive reward just for my viewers. Anyone who signs up using my link, you can claim up to $3,000 in bonuses simply for trading on their platform. So don't miss out. Start trading on Blow Fin using my link
[13:03] and grab those rewards. Now back to the video. So here's another example of the find a key level. And remember what I said earlier, there are multiple types of key levels besides just support and
[13:16] resistance. So you can look out for any of them. And in this chart, we can see uptrend structure because it keeps creating higher highs and higher lows. And from here, we can spot a trend line. Now, how did we know that there was a
[13:30] trend line here? Simple, because price had rejected this zone three times. When drawing a trend line, price must reject a zone at least two times in the past. So, once our key level is identified, we move on to the next step, which is to
[13:43] wait for price to approach that level again, like this. Now, since price has bounced off this trend line multiple times before, there's a chance that it can't just rely on that analysis alone. So we move to step three which is
[13:58] applying the hiken ashi. Looking at the hiken ashi candle we can see multiple dogee candles with small bodies. This tells us that price is still moving sideways. So there's no uptrend confirmation yet.
[14:11] After a few candles formed we can now begin to see the transition into an dogee candle to consecutive green candles with no lower wick. [music] So now we have price touching a trend line plus the hike and ashi confirming the
[14:26] uptrend which means we can now move to the final step which is the entry. So we place a buy position here set a stop loss slightly below the key level and take profit target at two times stop-loss
[14:39] here. Price ends up hitting the takerit target. Now it's completely up to you whether to fully close the position on this take-profit target or just The important thing is that the trade ends up profitable. Let's see another
[14:52] example. So again, the first step is finding a key level. And right here, price formed a lower high structure while rejecting this level multiple times. So we can draw a downwards trend line. Once the key level is confirmed,
[15:05] we move to step two. Wait for price to approach that key level again like this. Now notice that price has rejected this trend line multiple times in the past. So, there's a good chance it might reject it again, which means we
[15:19] can potentially look for a sell trade to take advantage of this possible downwards move. But if you watch closely, you can actually spot another key level here, a previous support level that has now turned into a resistance
[15:31] level. And in the [music] past, price has reacted to this level as well. This when multiple key levels line up in the same zone. This is the strongest type of key level, so the chance of price rejecting is much higher. Once the key
[15:44] level is identified, we move to step three. Confirm the setup using hiken ashi. And here the candles are still green showing a strong uptrend. So no signs of reversal yet. But after a few more candles formed, the candles started
[15:58] turning red and multiple candles with no upper wicks begin to appear. This tells us that the trend has shifted downwards, which confirms our setup. Now we can move to step four, which is the entry. For this trade, we can open a sell
[16:11] position right here. place our stop loss slightly above the key level and set a take-profit target at two times the stop loss. And as you can see, price moved down and hits the takerit perfectly. So, you can
[16:24] see just how effective the hike in Ashi is, especially when combined with price action strategies. Now, if you like the way I break down complex strategies into simple, easy to follow explanations and want to see how I actually analyze the
[16:36] markets in real time, I suggest joining my free Telegram community link in the description below. inside. I share my market analysis and trade setups every market analysis and trade setups every single day with my subscribers there.




⚡ Saved you 0h 16m reading this? Transcribe any YouTube video for free — no signup needed.