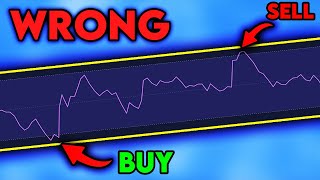

99% Use RSI Wrong!
45sChallenges common trading knowledge, sparking curiosity and debate among traders.
▶ Play Clip"The title promises a correction of common RSI misuse, and the video delivers with concrete adjustments and strategies, though the sponsor segment and some repetition slightly dilute the value."
The video explains that the RSI (Relative Strength Index) is one of the most popular trading indicators, but 99% of traders use it incorrectly by relying on default overbought/oversold levels (70/30) for mean reversion, which often leads to false signals. The creator demonstrates a more effective approach: adjusting the RSI settings to 80/20, confirming signals across multiple timeframes, and using price action for entry confirmation. Additionally, the video reveals the RSI's original purpose—measuring strength to identify pullbacks in trending markets—and provides a practical strategy for trading these pullbacks.
Most traders use RSI to find overbought and oversold areas (70/30), but this often fails because oversold can get more oversold, leading to false signals.
Using the default RSI settings on a chart gave 5 signals, 4 of which were losing trades, highlighting the need to filter signals.
Change the overbought/oversold levels from 70/30 to 80/20 to reduce the number of signals but increase their strength and reliability.
Confirm RSI signals on higher timeframes (e.g., daily) before entering trades; if no confirmation, skip the trade.
On a 1-minute chart, a parabolic move with RSI in oversold suggests a short, but confirmation on 5-minute and 15-minute charts is needed before entering.
Add price action confirmation like a double bar break (two candles showing hesitation, then price breaks the low) to increase trade quality. Enter immediately on the break, not waiting for candle close.
Set stop loss above the break bar. Take partial profits (e.g., 50%) when RSI returns to the mid-line, and use VWAP for additional profit targets.
RSI was designed to measure strength, not just overbought/oversold. In strong trends, RSI lives between 50 and 80 (upper quadrant) and bounces off the mid-line.
For uptrends, wait for price to pull back to the RSI mid-line and enter expecting a bounce. For downtrends, wait for RSI to hit the mid-line in the lower quadrant and short. This works only in trending markets, not sideways.
The pullback strategy should be combined with price action strategies for best results, as the creator promises to teach in a follow-up video.
The RSI is a versatile indicator that, when used correctly—with adjusted settings, multi-timeframe confirmation, and price action—can significantly improve trade quality. The key is to understand its original purpose as a strength indicator and apply it to trending markets for pullback entries.
What are the default RSI overbought/oversold levels?
70 and 30
03:19
What settings does the creator recommend for RSI to reduce false signals?
80 and 20
03:19
Why do default RSI settings often fail?
Because oversold can get more oversold, leading to false signals.
01:45
What is the original purpose of the RSI indicator?
To measure strength, not just overbought/oversold areas.
06:26
In a strong uptrend, where does the RSI typically live?
Between 50 and 80 (upper quadrant).
06:43
What is a double bar break?
Two candles showing hesitation, then price breaks the low of both bars to the downside.
05:12
When should you enter a trade after a double bar break?
Immediately when price breaks the low, without waiting for candle close.
05:25
What is the recommended stop loss placement for the short trade example?
Right above the break bar.
05:54
How does the creator take partial profits?
Take 50% of the trade when RSI returns to the mid-line.
05:54
What condition is necessary for the pullback strategy to work?
The chart must be trending, not moving sideways.
07:01
99% Use RSI Incorrectly
Highlights a widespread misconception, setting up the video's value proposition.
00:15Default Settings Produce 80% Losing Trades
Concrete example showing the failure rate of default RSI usage, emphasizing the need for change.
02:01Adjusting RSI to 80/20
A simple, actionable tweak that filters out weak signals, improving reliability.
03:19RSI's Original Purpose: Strength Measurement
Reveals the indicator's intended use, shifting the paradigm from mean reversion to trend strength.
06:26Pullback Strategy in Trending Markets
Provides a clear, rule-based strategy for using RSI to enter pullbacks, a practical application of the strength concept.
07:01[00:00] The RSI Or, if you re fancy, the relative strength index. The rsi is one of the most popular trading indicators out there. If you even have the slightest clue about trading, you have heard about this indicator.
[00:15] Books, websites, videos, there s tons of information about this one specific indicator. But with that said, 99% of people are actually using this indicator completely wrong.
[00:30] For example, If I could guess correctly you probably have used the rsi for finding overbought and oversold areas. The lower line being oversold and the upper line being overbought. Now if you ve actually used it like
[00:43] this you probably quickly figured out that sure it works sometimes but half the time it doesn t work very well at all. But what if I told you, this is the completely wrong way to use this indicator. And what if I also told you the
[00:57] default settings for the rsi that everybody uses are actually not the best settings. Well, im going to show you how to ACTUALLY use this indicator correctly and ill also go over Okay, so the rsi indicator measures strength. After all, its call the relative strength index.
[01:18] This indicator is a momentum oscillator. It measures the speed and change over a set number of bars and it oscillates between 0 and 100. So heres the problem most traders have.
[01:30] They plop the rsi on their chart and use it for mean reversion strategies. For example, overbought and oversold. So if the rsi went like this. The normal average trader would consider this oversold. So they would enter into a long position here.
[01:45] But just because something is quote on quote oversold that doesn t mean it can get more oversold. So there s an obvious flaw in wrong. We just have to perfect it. So here s the rsi chart and you can see if
[02:01] we are doing with the original style of thinking. It gave us 5 signals and if you look closely 4 of these 5 signals were losing trades. Now, every indicator ever is going to provide false signals. That s just how the world works.
[02:18] I know, its very sad. But our goals is to just limit those false signals so we don t get AS many so it provides more winning signals. A way I found to do this with the rsi is But before we go over that, let me show you this site called fyntura.
[02:36] Fyntura is a forex and crypto broker, but damn, its good one at that. First of all they don t have kyc requirement. Which is nice. Even if you re on an island with a volleyball, you can use fyntura.
[02:51] They also have extremely low commissions and spreads so you re not wasting money like you they have a 100% deposit bonus. All you have to do is use the link in my
[03:04] description, and if it s your first time signing up they will match whatever you first deposit. Yeah, I know, its literally free money. Go create an account with them if you trade crypto or forex. At the very least get the deposit bonus and see if you like it.
[03:19] Okay back to the video. To do this go to the settings of the rsi. Now the default settings are 70 30 for the overbought and oversold areas. I like to change these numbers to 80 20. Doing this will give us less signals but
[03:35] these signals we do have our going to be stronger and less likely to be wrong. The next step I like to do is confirm these signals with mutltiple timeframes. For example, here this chart on the hourly time frame gave us 2 signals.
[03:49] So were going to also check the rsi on the daily time frame and see what the signals are on that. As you can see here, we have 0 signals. So we wouldn t enter any of these trades because we don t have any confirmation on the higher timeframe.
[04:03] So now that we have created a process to raise the quality of these signals, how can we use this to spot some great trades? So here we are on the 1 minute time frame and the does a parabolic move upwards and the rsi goes in the oversold area. A good sign to enter
[04:19] a short. But then we do what we were talking about earlier and go to next highest timeframe. The 5 minute. Here, the rsi has not reached the oversold area yet. So we wait some more.
[04:31] and continues to head upwards. So good thing we waited on the short. Price then hits the oversold area again. We then check the 5 minute and this time,
[04:44] the rsi in the oversold area on the 5 minute. So that s good confirmation. For good measure, we check the 15 minute as well and it also in the oversold area.
[04:56] So these are all good signs to enter a short. But just because the rsi is providing signals to enters a short on multiple timeframes doesn t quite mean its time to enter yet. We still need some more confirmation on this trade to raise our odds of entering in good quality trade.
[05:12] A nice way to do this is to add some price action confirmation. Here the chart does a double bar break. Meaning there are two candles here showing signs of hesitation. Then price breaks the low of both these bars to the downside.
[05:25] Also as a side note, I do not wait for the close of this candle. We already have the confirmation. We just need price to break the low of these 2 candles. Once it does, we enter immediately.
[05:37] AS the cherry top right when this break happens, the rsi returns back to normal. So now instead of being overbought it return to the middle zone. Which is also a bearish indication. What I like to do is set my stop loss right above this bar. Now you can use your take profit in
[05:54] multiple ways. I personally like to do this. Go to your indicators tab and the vwap. The vwap on our chart is right here. So what I do is ill take partial profits say 50% of my trade when price comes back to the mid line of the rsi. So right here, I would have
[06:11] taken partial profits because the rsi returned to the mid line. Then I would take the rest of But this isn t actually my favorite way to use it. The rsi actually wasn t made for finding overbought and
[06:26] oversold areas like how everyone uses it. It was actually made as a way to find strength. As the name suggests. Relative STRENGTH index. So you can usually the rsi for bullbacks. Now when I started to use the rsi, I started to notice on very strong trends,
[06:43] the rsi would just live between 50 and 80. If the chart was strong the rsi would live in this upper quadrant and just bounce from the mid line to the upper line. Now for this strategy to work. The chart needs to be trending.
[07:01] If the chart is moving sideways like this, this strategy will not work. We need a chart that is trending like this. While the price is going up. Make sure its living in this upper quadrant. We then want price to come down
[07:15] to this mid line on the rsi. Once it does, we can enter the trade expecting this to be a pullback and for price to bounce off this mid line. And as you can see it works beautifully. Same thing with shorting.
[07:28] You want to find a strong downtrend and you want the rsi to be living in the lower quadrant. Wait for the rsi to hit the mid line Enter the trade expecting this to be a pull back. And boom, you have a glorious short trade. Just like the other strategy though,
[07:42] you shouldn t use this strategy just by itself. What I found, is if you incorporate some price rsi by watching this video. Next im going to show you some price action strategies you can use to pair with these rsi strategies.
[07:55] If you do both what im about to teach you in this video AND combine it with these rsi strategies. You re trading profits will skyrocket. Thanks for watching and ill see you guys next time.
⚡ Saved you 0h 08m reading this? Transcribe any YouTube video for free — no signup needed.



![BEST MACD Trading Strategy [86% Win Rate]](https://img.youtube.com/vi/rf_EQvubKlk/mqdefault.jpg)