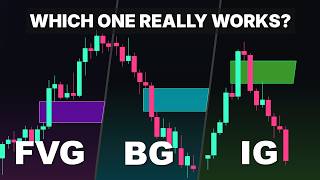

Is This SMC Indicator Actually Useful?
45sDirectly addresses a common trader question and sets up a skeptical review, sparking curiosity.
▶ Play Clip"The title promises the 'best in the game' but delivers a balanced review with some praise and caveats—solid content, though the hype is slightly oversold."
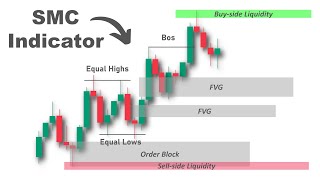
This video reviews the Price Action Toolkit by Flux Charts, a TradingView indicator that automatically identifies Smart Money Concepts (SMC) on charts. The reviewer tests each feature—fair value gaps, order blocks, liquidity grabs, and more—to assess its practical utility for traders.
The video begins by questioning whether SMC indicators are truly helpful or just visually appealing tools, setting up a detailed review of the Price Action Toolkit.
The indicator marks the latest FVGs cleanly, adjusts to different timeframes, and allows simultaneous display of higher timeframe FVGs. Sensitivity settings filter smaller gaps, and users can choose to detect FVGs from same-color or mixed candles.
Inversion FVGs are failed FVGs that get filled, turning support into resistance. The indicator automatically identifies these key areas, updating with timeframe changes.
The indicator marks the last bearish candle before a bullish impulsive move and vice versa. However, many potential order blocks are filtered out, and win rates require extensive backtesting.
Flux Charts offers a separate tool for automated backtesting. Users can set entry rules (e.g., bullish FVG retest), risk-to-reward ratios, and deposit parameters to get results in seconds.
Breaker blocks are failed order blocks where support becomes resistance or vice versa. The indicator marks these zones, helping traders spot shifts in market structure, though reactions aren't guaranteed.
The indicator shows red/green circles for bearish/bullish liquidity grabs. These occur when price wicks above swing highs or below swing lows, signaling potential reversals. The feature is available for free on TradingView.
In an uptrend, the reviewer demonstrates waiting for a pullback to an order block, then using a lower timeframe double bottom for confirmation. He notes that liquidity builds below equal lows, and a sweep can trigger a strong bullish move.
The indicator automatically displays breaks of structure (BOS) and changes of character (Choch). Users can adjust swing length settings to match their manual analysis.
The indicator identifies equal highs and lows, which are prone to manipulation and liquidity sweeps. Increasing the ATR multiplier detects more of these levels.
The reviewer concludes the indicator does a good job of automatically identifying SMC concepts, comparing favorably to most indicators. He mentions a 15% discount code and advises doing own research.
The Price Action Toolkit is a solid SMC indicator that automates concept identification, but traders should verify its signals with manual analysis and backtesting. It offers useful features, with liquidity grabs available for free.
What is an inversion fair value gap?
A failed fair value gap that gets completely filled, turning support into resistance.
02:14
How does the indicator identify order blocks?
It marks the last bearish candlestick before a bullish impulsive move and the last bullish candlestick before a bearish impulsive move.
02:55
What is a breaker block?
A previous order block that failed to reject the price, turning support into resistance or vice versa.
04:45
What does a bearish liquidity grab signal?
A potential downward movement, marked when price wicks above a previous swing high.
05:41
What is the free feature provided by Flux Charts?
The liquidity grabs indicator, available on TradingView.
07:54
What does a change of character (Choch) indicate?
A potential reversal, occurring when price breaks swing lows to the downside in a bullish scenario.
08:22
How can you increase the detection of equal highs and lows?
By increasing the ATR multiplier in the settings tab.
09:30
Inversion FVG Definition
Clarifies a key SMC concept that is often misunderstood.
02:14Automated Backtesting
Shows a practical tool for testing strategies quickly, saving hours of manual work.
04:02Liquidity Grab Trading Strategy
Provides a concrete example of combining SMC tools for a high-probability setup.
06:08Free Liquidity Grab Tool
Highlights a cost-effective way to access a premium feature.
07:54Indicator Quality Assessment
Gives an honest verdict on the indicator's performance relative to others.
09:43[00:02] price action tools actually provide useful information. The rest are just unnecessary confirmations. Which brings us to this question. With all the advancements in coding, is there an indicator that can automatically display
[00:15] smart money concepts on the chart? Well, there are a few of them, but are they there are a few of them, but are they really helpful? Let's find out. Today, we're reviewing a smart money trading indicator that many of you requested. It
[00:27] identifies all of these smart money concepts directly on the chart. We're going to go through each one to find out whether an SMC indicator like this is actually useful or just another tool that looks good but doesn't really help.
[00:39] So, without further delay, let's get into it. the price action toolkit developed by Flux Charts. Let's apply it to the
[00:51] I've already turned off all the features so we can go through each concept one by one. The first concept it marks on the chart is fair value gaps. So let's enable the FVGs and hit okay.
[01:05] As you can see the indicator does a pretty good job of marking the latest FVGs without making the chart look too messy. If we change the time frame, it adjusts and marks the fair value gaps for that
[01:17] specific time frame. But there's also another option that lets you see higher simultaneously. If I go to the settings and scroll down to the time frame section, I can add another one and apply it to the chart.
[01:32] So here we are on the one minute chart, but I can also observe the 15-minute fair value gaps as well. I also noticed that in the settings tab, increasing the sensitivity filters out smaller gaps and only shows the larger
[01:45] There's another option that lets you choose between detecting FVGs formed by candles of the same color or mixed colors. If you select same color, it filters out the FVGs formed with mixed candles, which might be helpful for back
[02:00] testing. Overall, the indicator does a solid job of automatically identifying fair value gaps on the chart. Now, let's move on to the next concept, inversion fair value gaps.
[02:14] If you're wondering what inversion fair value gaps are, I must say an inversion fair value gap is a failed fair value gap that gets completely filled. At that point, the support becomes resistance and if the price retraces back to this
[02:29] zone, it will act as another key trading area to go short. By enabling the inversion fair value gaps on the chart, we can see that the automatically identifying these key areas. Similarly, when we change the
[02:43] time frame, the latest inversion FVGs are updated and visible on the chart. Next up, we have the order blocks. Let's check the box and see how they are
[02:55] applied to the chart. Now, we can see multiple order blocks displayed. From observation, it appears the indicator marks the last bearish candlestick before a bullish impulsive move as an order block. And similarly, the last
[03:09] bullish candlestick before a bearish impulsive move. However, with this definition, many potential order blocks are filtered out and not marked on the are filtered out and not marked on the chart.
[03:23] POIs, points of interest, specific price zones on a chart where market reactions are likely to occur. So, essentially, when the price returns to these order blocks, we expect a possible rejection and look to open a
[03:35] trade. The indicator uses a unique method to identify these order blocks showing only those confirmed by market structure and trading volume. However, determining their win rate would require extensive
[03:47] back testing. Additionally, we must look for the entry reason and confirmation in the lower time frames. Now, talking about back testing, there's another tool developed by Flux Charts that can help. Price action automation. Imagine if we
[04:02] wanted to automatically back test a simple fair value gap entry. The only testing period and adjust the FVG settings for a long
[04:14] trade condition. Let's just use a bullish FVG on the retest. Similarly, we'd apply the same rules for the short setup. We then define a solid risk-to-reward ratio such as 1:2 for both entries.
[04:27] Next, we set our initial deposit, the risk per trade, and the maximum number of successive orders allowed. And that's it. You'll have the full back testing it. You'll have the full back testing results in a matter of seconds.
[04:45] So, what is a breaker block exactly? A breaker block is a previous order block that failed to reject the price. In this case, support turns into resistance or resistance turns into support, creating a new point of
[04:58] interest. If the price taps into a breaker block, we anticipate a potential rejection in the opposite direction, typically signaling a continuation of the new trend. Now, if we go back to the chart, we can
[05:12] failed order blocks as breaker block zones. This helps traders identify areas where a shift in market structure has occurred. Just like with order blocks, determining the win rate of breaker blocks requires extensive back testing.
[05:27] These areas may not always result in a reaction, but when they do, they can offer high probability trade setups. Next up, we have liquidity grabs. When you apply it to the chart, you'll notice red and green circles appearing.
[05:41] These represent bearish and bullish liquidity grabs, respectively. when the price wicks above a previous swing high, the indicator identifies it as a bearish liquidity grab, signaling a potential downward movement.
[05:54] Similarly, when the price wicks below a previous swing low, it is marked as a bullish liquidity grab, indicating a possible upward move. Liquidity grabs highlight areas where the market sweeps stop- losses before reversing direction.
[06:08] These zones can be powerful signals for smart money entries, especially when combined with other concepts. So, let me show you how. In this example, the uptrend. So, we're only interested in buy opportunities.
[06:22] the current price because it's too high and may correct at any moment. What we need is a pullback or correction to enter at a better price. So, where could our potential point of interest be? This red candle before the impulsive bullish
[06:36] move defines our trading range and serves as a potential order block. If the price taps into this level, it could provide a high probability long setup. However, it's important to remember that price reversing exactly from this zone
[06:48] is not guaranteed. Also, since many traders may have marked this same area as a point of interest, the likelihood of manipulation or a liquidity hunt increases. So, how do we approach this? First, wait for the price
[07:02] to retrace into the zone. Then, zoom into a lower time frame to look for confirmation. On the lower time frame, we observe that double bottom reversal pattern, indicating that it attempted to break
[07:15] below twice but failed. This suggests bearish weakness and often encourages traders to go long. As more traders enter long positions, liquidity builds up below the equal lows of the double bottom. As smart money traders, we
[07:30] anticipate that the price may wick below this level, triggering stop- losses and collecting liquidity before quickly reversing back into the range. This liquidity grab when combined with confirmation from order blocks, market
[07:42] structure, and other SMC tools often signals the beginning of a strong bullish move. Now, one important thing to note about the liquidity grab feature is that Flux Charts has provided it for free. To
[07:54] access it, simply open the indicators tab on Trading View, type liquidity grabs, and select the indicator provided by Flux Charts. This gives you access to the same liquidity grab tool available in the price action toolkit, allowing
[08:08] you to analyze the signals it provides directly on your own charts at no cost. Now we reach the next topic, market structure. Let's apply the breakup structure, change of character. If you're familiar with market structure
[08:22] concepts, you know that in a bullish scenario, when the market breaks the is called a break of structure and signals trend continuation. occurs when the price breaks the swing lows to the downside, signaling a
[08:37] potential reversal. When the price fails to create a new high before a change of character occurs, it indicates a loss of momentum. This is identified as change of character plus on the indicator. If you would like to learn more about this
[08:51] topic and how exactly we determine market structure and swings, click on the link in the top right corner. If you apply the market structure concepts to the chart, the indicator displays breaks and changes automatically.
[09:04] However, you may notice that the default settings mark them differently from how you might do it manually. But by adjusting the swing length settings, you can get results that more closely match your manual analysis.
[09:17] Next up, we have equal highs and equal lows. the chart because there is a higher chance of manipulation and liquidity sweeps occurring around them as more traders are watching these areas.
[09:30] The indicator does a good job of automatically identifying and marking equal highs and lows on the chart. By increasing the ATR multiplier in the settings tab, the indicator will detect and highlight more equal highs and lows
[09:43] by increasing the variations in price swings. The indicator's features don't end there. Overall, the indicator does a good job of automatically identifying compared to the majority of indicators that I have seen. Based on everything we
[09:58] discussed today, let us know your thoughts in the comments below. What do you think about this indicator? Do you find it useful? Also, feel free to share your experience using smart money indicators. We'd love to hear from you.
[10:13] The price action toolkit by Flux Charts is a premium indicator, but if you're interested in trying it out, you can get 15% off using the code smart. Links are in the description. However, make sure to do your own research before making a
[10:27] purchase. Check out reviews on Trustpilot and see what other traders are saying. So guys, I hope you enjoyed today's video. If you did, please hit the like button and I'll see you in the next episode.
⚡ Saved you 0h 10m reading this? Transcribe any YouTube video for free — no signup needed.