
AI Summary
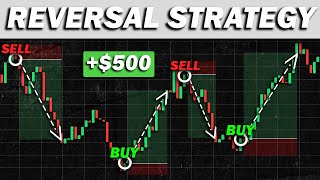
This video presents three strategies for identifying trend reversals in day trading across crypto, forex, and stocks. The presenter emphasizes the importance of waiting for confirmation signals rather than assuming a reversal based on price levels alone. The strategies include break of structure, key level bounces with stochastic confirmation, and using exponential moving averages (EMAs).
Chapters
The video aims to teach viewers how to spot trend reversals before they happen, addressing the common frustration of buying at the top of an uptrend.
A reversal is when an uptrend switches to a downtrend or vice versa. The presenter warns against assuming a reversal just because price has gone too high, as momentum can continue.
Identify an existing trend, draw a trendline, wait for price to break the trendline, then look for confirmation of momentum loss such as a double top pattern before entering a short position.
Place stop loss slightly above the double top pattern and set profit target at a 2:1 risk-reward ratio.
Another example: price forms lower highs and breaks the trendline, indicating weakening buying pressure. Confirmation comes when price forms lower lows, establishing a downtrend.
Find a key resistance level, wait for price to approach it, use stochastic indicator to confirm overbought conditions, and wait for stochastic to cross below the overbought line before shorting.
Apply two EMAs (e.g., 10 and 20) to the chart. When the faster EMA crosses below the slower one, it signals a downtrend. Use this in conjunction with a key level to confirm reversals.
The presenter discusses broker fees and promotes PrimeXBT, offering a bonus with code 'data'. The video concludes with a recap of the strategies.
The video provides practical reversal trading strategies that emphasize confirmation over assumption, with clear entry and exit rules. The key takeaway is to combine trendline breaks, key levels, and indicators like stochastic or EMA to increase the probability of successful trades.
Mentioned in this Video
Tutorial Checklist
Study Flashcards (8)
What is a trend reversal?
easy
Click to reveal answer
What is a trend reversal?
A reversal is when an uptrend switches to a downtrend or vice versa.
00:58
Why is it wrong to assume a reversal just because price is too high?
easy
Click to reveal answer
Why is it wrong to assume a reversal just because price is too high?
Because if prices are going higher, it means upward momentum is strong, and prices can always continue higher.
01:14
What is the first step in the break of structure strategy?
easy
Click to reveal answer
What is the first step in the break of structure strategy?
Find an existing trend and draw a trendline.
01:52
What confirmation is needed after a trendline break to enter a short?
medium
Click to reveal answer
What confirmation is needed after a trendline break to enter a short?
Signs of momentum loss, such as a double top pattern or failure to form higher highs.
02:57
What is the recommended risk-reward ratio for profit target?
easy
Click to reveal answer
What is the recommended risk-reward ratio for profit target?
2:1 risk-reward ratio.
03:52
In the key level strategy, what does the stochastic indicator confirm?
medium
Click to reveal answer
In the key level strategy, what does the stochastic indicator confirm?
Overbought conditions, and a cross below the overbought line confirms downward momentum.
06:40
What settings are suggested for the exponential moving average?
medium
Click to reveal answer
What settings are suggested for the exponential moving average?
Two EMAs, one with period 10 and one with period 20.
08:00
When does the EMA cross signal a downtrend?
easy
Click to reveal answer
When does the EMA cross signal a downtrend?
When the faster EMA crosses below the slower EMA.
08:12
💡 Key Takeaways
Momentum over price level
Challenges the common misconception that high prices automatically lead to reversals.
01:14Multiple confirmation signals
Combining trendline break and double top increases trade reliability.
03:12Stochastic for confirmation
Using stochastic overbought/oversold levels adds a timing element to key level bounces.
06:40EMA cross as trend filter
EMA crossovers provide a simple, visual way to confirm trend direction changes.
08:12Full Transcript
[00:03] easily spot trend reversals before they even happen now before we if you need an award-winning trading platform that offers low fees bt use the code data to earn 50 extra
[00:18] capital on your first deposit link in the description below now back to the video so first let me ask you a quick question have you ever encountered a situation where you took a buy position when the
[00:31] where you took a buy position when the price was on an uptrend only for that trend to reverse downwards which leaves you holding at the top if so i know it's frustrating because i've been there before
[00:43] and so after countless hours of research and back testing i actually found a strategy that you can use to predict these reversals because we're going to go very in depth in this video so first
[00:58] reversal trend direction like in this example we have an uptrend that switches to a downtrend then you got yourself a reversal simple
[01:14] is they think that because the price has gone too high then it's automatically going to reverse this is actually the wrong mindset to have because think about it
[01:26] if prices are going higher and higher it means that the upwards momentum is so if you tried shorting this market just because you thought it was too high then you're actually trading against a trend which is not a good idea
[01:39] remember prices can always continue higher so with that being said here are a couple of strategies that you can use to predict reversals before they happen the first one is called brick of
[01:52] the first one is called brick of structure and this is how it works so first in order to spot a reversal the first step is you want to find an existing trend and in this chart
[02:04] we actually spotted a clear uptrend here notice how the price is structured it formed higher highs while respecting this bottom level meaning we can also draw an upward trend line below it
[02:16] now here's what you need to remember as long as the price remains above the trend line it means that the uptrend is still valid so in order for us to find a reversal the price has to break the trend line
[02:28] first and so we want to wait until the price breaks the trend line as you can see here but be cautious just because the price broke out of the trend doesn't mean that a reversal will happen because
[02:42] the long-term trend is still up meaning that the price still has a chance to go back upwards so to confirm that the price will not go we need to wait for signs of momentum loss so let's let the price run
[02:57] loss so let's let the price run until we find a confirmation up and failed then it tried again and failed the second time which created a double top pattern here
[03:12] aren't strong enough to push the price back up so now we already have multiple reversal signals first we saw a brick of a trendline which means the price broke the uptrend
[03:25] structure and a double top pattern indicating a because buyers fail to push the price back up so all these factors combined has led us to believe that the trend is going to
[03:37] and so this is a good opportunity to take a short position and of course no strategy is 100 accurate so we need to make sure that our exit strategy is in place so for our stop loss we can place it
[03:52] which is slightly above the double top pattern and set your profit target pattern and set your profit target at 2 1 risk ratio and as you can see
[04:05] let's look at other variations of this technique so in this chart we spotted a clear uptrend as price is forming higher highs and below it we have multiple rejections meaning we can place an upwards trend
[04:19] line next we can see the price failed to make and formed a lower highs instead while also breaking the upwards trend line so this indicates that the upwards buying pressure is weakening
[04:34] back but again don't take any positions yet because remember the overall trend is still an uptrend so we still need further confirmation next we can see that the price tried
[04:49] pushing back up and failed now notice what the price is it formed lower highs and lower lows which means we now have a current downtrend so let's recap what we have currently
[05:02] we have momentum loss indicated by the price failing to form higher highs then we have a trendline breakout indicating that the uptrend structure and finally we have a current downtrend because prices forming lower highs and
[05:16] so all these factors combined has confirmed us that the trend has shifted and so this is a good opportunity to enter a short position and for your exit strategy you can place your stop loss at the nearest key level
[05:30] and set your profit target at 2 1 risk ratio and as you can see this ends up being another profitable trade what i just showed you is how we spot reversals if the price were to break out
[05:45] of a key level but remember prices don't move like this there are also scenarios where the price bounces off the key level instead to spot reversals which is using key levels and this is
[06:00] how it works the first step is we want to find a key level for the price to bounce off and in this case we actually spotted a resistance level up here because price went up hit and reversed
[06:13] is we want to wait for the price to approach that key level once again and as you can see we saw an uptrend approaching the resistance level but remember you cannot just assume that a reversal will happen
[06:28] because price can always break right so we need to have extra confirmation to make sure that the price will actually reject this key level and we can do that by looking for
[06:40] with the help of the stochastic indicator so first go to the indicator section type in stochastics settings i like to leave it as it is and just use
[06:55] the default settings so for this setup what we want to look while the stochastic is displaying overbought or oversold like in this example right here but again prices can still break right
[07:09] through even though the stochastic is that overbought so to confirm that there's actual downwards momentum at this area you want to wait for the sarcastic to cross below the overbought lines again
[07:21] and once this happens you can take a short position and just in case the trade fails we need to have our exit strategy ready so for our stop loss we can place it slightly above the key level
[07:34] the risk and as you can see this trade ended up being profitable now moving on to the third strategy for
[07:46] spotting reversals which is by using trend indicators like the exponential moving average and this is how it works so first go to the indicator section type in exponential moving average
[08:00] and apply two of it onto your charts and for the settings one by 20. so now you have two ema applied
[08:12] and the way we read this indicator is very simple if the line crosses above uptrending and if the line crosses below it indicates that the market is downtrending however for this version of the strategy
[08:27] we don't immediately take positions just because the ema crosses over because if the market is unarranged like this it signals so instead you want to use this
[08:40] a reversal and this is how you do it so again the is you want to find a key level for the and we actually spotted a resistance level up here as price goes up
[08:55] hit and reverse downwards next you want to wait for the price to approach the same key levels again and once the price approached it you use the ema to confirm the trend change at this area by waiting for the lines to
[09:10] and once this happens you can take a short position now for your exit strategy you can place your stop loss right where the ema crosses over and set your profit target at 2 1 risk
[09:23] ratio and as you can see so those are all the different strategies that you can use to spot reversals using the data trader technique now a
[09:38] experiencing is that they tend to lose a significant amount of their profit because the broker fee is too high but luckily the sponsor for today's video primex bt
[09:50] solves that problem primex bt is an award-winning trading platform that supports over 30 plus assets including crypto very low fees
[10:02] forex pairs and point zero five percent for crypto for scalping and day trading and exclusively for data trader viewers if you sign up using the code data you
[10:16] will earn an extra fifty percent bonus capital on your first deposit for if you deposited one thousand dollars they will give you an extra five hundred you can do that by clicking the link in the description below
[10:29] so that's all for today thank you so much for watching and i'll see you in much for watching and i'll see you in the next video



