
The #1 Mistake in Drawing Trend Lines
42sReveals a common error traders make and provides a clear, actionable fix that saves viewers from costly mistakes.
▶ Play Clip"Delivers a solid, practical trendline strategy with clear examples, though it includes a mid-video subscription plea."
This video provides a comprehensive guide to trading using trend lines, covering how to draw them effectively and how to use them to identify high-probability trade setups. It explains two primary patterns—continuation and breakout—and demonstrates confirmation techniques using price action and indicators like stochastics and RSI.
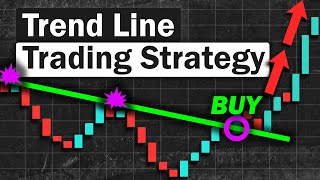
Trend lines are simple lines drawn on a chart that represent market trends. They offer high win-rate trade opportunities when price approaches these key levels.
Continuation pattern: price bounces back in the direction of the trend after hitting a trendline. Breakout pattern: price breaks out of a trendline, causing a trend reversal.
Draw trend lines to get the most touches possible. Adjust the line to maximize touches, treating it as a general area like support and resistance.
Wait for price to hit the trendline, then confirm with a pullback pattern. Draw a mini trendline at the pullback and take a position when price breaks out of that mini trendline.
In an uptrend, wait for stochastics to be oversold and cross back above the oversold level. In a downtrend, wait for stochastics to be overbought and cross back below the overbought level.
Do not trade breakouts blindly. Look for signs of momentum loss, such as failure to make higher highs (in an uptrend) or lower lows (in a downtrend), before the breakout.
Spot double rejections (e.g., double top or double bottom) before a breakout to confirm a trend change. This indicates momentum loss and a strong support/resistance zone.
Set RSI levels to 50. Only take buy positions when RSI is above 50, and sell positions when RSI is below 50. Wait for RSI to cross the 50 line to confirm a breakout.
Trend lines are powerful tools for identifying trading opportunities, but they require confirmation from price action or indicators. By mastering drawing techniques and using confirmation tools like stochastics and RSI, traders can improve their win rate.
What are the two types of patterns that form when price approaches a trendline?
Continuation pattern and breakout pattern.
00:44
How should you draw a trendline to make it effective?
Draw it to get as many touches as possible, treating it as a general area.
01:26
What is the continuation pattern?
Price bounces back in the direction of the trend after hitting a trendline.
00:44
What is the breakout pattern?
Price breaks out of a trendline, causing the trend to switch directions.
00:57
How do you confirm a continuation pattern using stochastics in an uptrend?
Wait for stochastics to be oversold and cross back above the oversold level.
04:00
What is a sign of momentum loss before a breakout in an uptrend?
Price fails to make higher highs and instead makes a lower high.
05:48
What is a double rejection pattern?
Price fails to make a new high/low twice, forming a double top or double bottom.
06:44
How do you set up RSI for this strategy?
Change the RSI levels to 50.
07:56
When should you take a buy position using RSI?
Only when RSI is above the 50 line.
08:10
Drawing Trend Lines for Maximum Touches
Emphasizes that trend lines are general areas, not exact lines, which is a key insight for traders.
01:26Pullback Confirmation for Continuation
Shows a concrete method to confirm continuation patterns, increasing trade reliability.
03:13Momentum Loss as Breakout Signal
Highlights the importance of observing price action for momentum shifts before trading breakouts.
05:48RSI 50 as a Filter
Provides a simple, objective rule for filtering trades, which is valuable for systematic trading.
07:56[00:02] you need to know about how to trade using trend lines so what you'll learn from this video is first how to actually draw them properly and second how you can utilize the trend lines to find high
[00:16] further ado let's get on with the video first of all what are trend lines so trend lines are simply market and the reason we draw them is because
[00:31] when the price approaches these key levels it can offer you multiple high win rate trade opportunities for example in a trendline strategy there are two types of patterns that
[00:44] may form when price approaches a trendline the first pattern is called the continuation pattern which is formed when the price bounces back to the direction of a trend right after hitting a trendline and the
[00:57] pattern is the breakout pattern which is formed when the price broke out of a trend line causing the trend to switch directions the trend line doesn't guarantee that a trend change
[01:12] will occur you need to use additional price action techniques to confirm your analysis which i will discuss later in the video i'm going to show you a simple way of drawing trend lines effectively one of
[01:26] ask when drawing trend lines is should you draw them hitting the wick's end the candles close or the candle's body well the answer is you want to draw them where it can get you the most amount of touches as
[01:40] possible let me give you an example in this chart we spotted a current uptrend as prices made higher highs and higher lows now because this is an uptrend
[01:52] line below the trend then you want to adjust the trend line then you want to adjust the trend line to get as many touches as possible now notice that there are some points that are overlapping the trend line
[02:06] trend line at all which is perfectly fine because remember a trend line is supposed to be treated as a general area just like support and resistance so let's look at another example
[02:20] here we spotted a current downtrend as prices made lower highs and lower lows and because this is a downtrend line above the trend and again you adjust it to get as many
[02:34] touches as possible and so it's that simple so now that you know how to draw trendlines effectively it's time to go in depth into how you can utilize these trendlines to find high probability trait setups
[02:48] so first let's start with the continuation pattern which is a pattern that occurs when price bounces back to the direction of a right after hitting a trend line now remember
[03:00] you cannot immediately take a position just because the price hits a trend line you need to use other price action techniques to confirm your analysis and a good technique that you can use to confirm a continuation pattern
[03:13] the pullback the next step is to wait for the price to confirm the continuation pattern by waiting for it to break out of the once the pattern was confirmed you take a buy position
[03:33] we spotted a downtrend and so we place our trend line above here then as we look at the current price we spotted another possible continuation pattern so the next step is you want to confirm
[03:46] by drawing a mini trend line at the pullback and once the price broke out pullback and once the price broke out you take a sell position
[04:00] you confirm a continuation pattern is the stochastics here's how the strategy works in this chart we spotted a current uptrend and so we place our trend line below it
[04:12] now as we look at the current price we spotted a possible continuation pattern as price hits the trend line and at this point notice that the stochastics is at the oversold level and so you want to utilize the
[04:25] continuation pattern by waiting for it to cross back inside the oversold level once the pattern was confirmed you take [Music]
[04:38] so let's look at another example in this chart we spotted a downtrend and so we place our trend line above the downtrend next as we look at the current price we spotted another possible continuation
[04:51] as price hits the trend line while the stochastics is at overbought stochastics to confirm the continuation pattern the overbought level and once the pattern was confirmed you
[05:06] and once the pattern was confirmed you take a cell position now moving on to the second pattern which is called the breakout pattern of a trendline causing the trend to switch directions
[05:21] you cannot take a position just because the price broke out of a trendline because it doesn't guarantee that a trend change will occur you still need breakouts and one of the ways you can do this is
[05:35] by looking for signs of momentum loss before the breakout let me give you an example in this chart we can see that the price is on an here now you can see that the price were
[05:48] making higher highs however when we looked at the latest price action the price suddenly made a lower highs instead what this means is that buyers failed to push the price higher
[06:00] which is a sign of momentum loss then we saw that the price broke out of the trend change so this is a good opportunity to take a sell position [Music]
[06:14] let's look at another example here we spotted a downtrend and so we place our trend line above it now notice that the price were making lower lows before suddenly it made a higher lows instead indicating
[06:27] that a downwards trend was losing momentum then we saw the again further confirms the trend change and so this is a good opportunity to take a buy position
[06:44] can use to confirm a trendline breakout is by spotting double rejections before a breakout appears let me give you an example in this chart uptrend as prices were making higher highs now
[06:58] as we look at the latest price action we saw that the price failed to make higher highs and formed a double top pattern instead area which is also a sign of momentum loss
[07:12] we saw the price broke out of the trend line which further confirms the trend so this is a good opportunity to take a sell position
[07:26] here we spotted a downtrend and so we place a trend line above it as prices were making lower lows then we also noticed the same double rejection indicating that there's a strong support zone within this area
[07:41] trend line which again confirms the trend change to and so this is a good opportunity to take a buy position
[07:56] you confirm a price breakout pattern is the rsi but first to the indicator so you want to go to the indicator settings and change these two values to 50.
[08:10] middle like this and the way we implement the rsi to our strategy is by only taking buy positions if the rsi is above the 50 line and only taking cell positions if the
[08:23] rsi is below the 50 line so let's look at this strategy in action we spotted an uptrend and so we want to draw our trend line below here now notice that the price broke below the trend line signaling a possible
[08:38] trend change however you can see that the rsi is and so you don't want to take any positions yet you need to wait for the rsi to confirm the trend change by waiting for it to cross below the 50
[08:51] line once this happens you take a sell once this happens you take a sell position can immediately trade right now and all i ask for in return is
[09:08] for you to invest 2 seconds of your time into liking the video and subscribe to it literally takes only 2 clicks but it and you can also check out my other videos as well so thank you guys for
[09:21] watching and i'll see you in the next video




⚡ Saved you 0h 09m reading this? Transcribe any YouTube video for free — no signup needed.