
The #1 Simple Indicator for Beginners
53sQuickly introduces a popular indicator and promises a simple solution, appealing to novice traders.
▶ Play Clip"Delivers solid, actionable strategies for the Supertrend indicator, though the title oversells 'BEST' and includes some filler."
This video presents a comprehensive tutorial on using the Supertrend indicator for day trading forex, emphasizing its simplicity and effectiveness for beginners. The presenter explains the basic usage of the indicator, highlights its main drawback in ranging markets, and introduces three advanced strategies to filter signals and improve accuracy.
Supertrend is a simple trend-following indicator that provides immediate buy or sell signals. It is based on ATR, incorporating both momentum and market volatility.
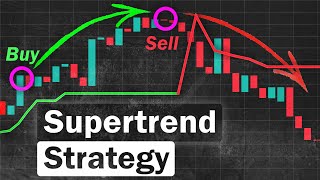
The indicator is a line that switches between green and red. Green indicates a buy signal, red indicates a sell signal. The basic strategy is to take a position whenever the line changes color.
Supertrend constantly gives signals, even in ranging markets. This forces traders to take positions when there is no trend, leading to losses. The market can be trending or ranging, and the indicator does not distinguish.
To filter signals, use three Supertrend indicators with different settings: (3,12), (1,10), and (2,11). Only take a trade when all three lines are the same color. This confirms a strong trend.
Exit a trade when the lines no longer match in color, or use a take profit or stop loss. The example shows closing a buy when the lines diverge.
Combine Supertrend with the 200 EMA to filter trades based on the longer-term trend. Only take buy signals when price is above the 200 EMA, and sell signals when price is below it.
Use the Kumo Cloud (Ichimoku) with only the two lead lines. Only take buy signals when price is above the cloud, and sell signals when price is below the cloud. Avoid trades when price is inside the cloud.
Exit a trade when price crosses back over the cloud, or use a take profit or stop loss. The example shows closing a position when the candle closes inside the cloud.
The Supertrend indicator is a powerful tool for beginners, but it must be used with filters to avoid false signals in ranging markets. By combining it with other indicators like the 200 EMA or Kumo Cloud, traders can significantly improve their accuracy.
What is the basic signal of the Supertrend indicator?
Green line indicates a buy signal, red line indicates a sell signal.
01:11
What is the main problem with using Supertrend alone?
It gives signals non-stop, even in ranging markets, forcing traders to take positions without a trend.
01:27
What are the three Supertrend settings used in the triple Supertrend strategy?
(3,12), (1,10), and (2,11).
02:53
In the triple Supertrend strategy, when do you take a trade?
Only when all three lines are the same color.
03:07
How do you exit a trade in the triple Supertrend strategy?
Exit when the lines no longer match in color, or use a take profit/stop loss.
03:32
What is the rule for combining Supertrend with the 200 EMA?
Only take buy signals when price is above the 200 EMA, and sell signals when price is below it.
05:07
What is the rule for combining Supertrend with the Kumo Cloud?
Only take buy signals when price is above the cloud, and sell signals when price is below the cloud.
06:46
What is the exit rule for the Kumo Cloud strategy?
Exit when price crosses back over the cloud, or use a take profit/stop loss.
07:53
Supertrend's Fatal Flaw
Highlights the critical issue of using Supertrend alone in ranging markets, which is essential for traders to understand.
01:27Triple Supertrend Filter
Introduces a practical method to filter false signals by using multiple timeframes of the same indicator.
02:37Combining with 200 EMA
Shows how to align short-term signals with the long-term trend, a fundamental principle in trading.
04:39Kumo Cloud Integration
Demonstrates another effective filter using a popular indicator, providing traders with an alternative strategy.
06:17[00:03] you can use with the super trend indicator if you're still a new trader and you want to find a very simple indicator a trend but also gives specific buy or sell
[00:18] immediately then the super trend is the perfect indicator for you so a good thing about this indicator is that not only it's very simple to use but it's also a very good indicator
[00:32] atr so that means the indicator generates not only based on the momentum but also the current volatility of the market and
[00:44] if you have any suggestions for future videos or just questions about trading you can drop them in the comments below i'm still a small channel so i'll still have time to read and reply to all of
[00:56] the comments so without further ado let's continue with the video so if you open the super trend indicator this is what it looks like a single line that switches from green to red and vice versa and how you use it is
[01:11] pretty self-explanatory if the line turns green meaning you take if the line turns green meaning you take a buy position close your previous buy position and open a new cell position but
[01:27] there's actually one big problem if you use the strategy this way because the super trend indicator is constantly giving out signals non-stop so when you're using this indicator there are no times where you don't take
[01:41] it's either you are forced to take a buy or sell position there are no stops so this can be a huge problem because if you're a trader you need to know that the market isn't always trending the market can
[01:57] also go in a range so because the super trend is constantly showing signals non-stop meaning it will also show signals when the market is on a range like in this example
[02:09] you can see that the market was on an uptrend and the super trend displayed a uptrend and the super trend displayed a buy signal already ended and the market went flat but the problem
[02:23] because the super trend is always giving signals it displayed a sell signal even though there wasn't any trend these range markets so that we only take signals from the
[02:37] super trend if the market is actually trending this is how you do it first you need to put three super trend indicators the first indicator value you need to set it by 3 and 12.
[02:53] the next one you set it as 1 and 10 and the third one you set it as 2 and 11. so the way we use the supertrend strategy is by only taking positions if all the
[03:07] lines are in the same color for example in this chart we can see that the bottom line turned green but the other two lines are still red so you don't want to take positions yet
[03:20] you can see at this point all the lines turned green and this is where you want to take a buy position
[03:32] chart we can see that the top line turned red but the other two lines are still green so you don't want to take any positions yet next you can see all the lines are now
[03:45] so this is where you want to take a cell position a lot of ways you can do this the first one is set a take profit or
[04:00] so you close your position if your trade reaches a certain amount of profit or losses another way is if the color of the lines no longer matches like in this example we can see that the
[04:14] color of the lines are all green so you take a by position next switches to a red color
[04:26] and now that the lines no longer matches this is where you want to close your buy this is where you want to close your buy position when trading the super trend indicator is by combining it with another
[04:39] indicator such as the 200 ema [Music] so because the super trend can be used to detect short to medium term trends and the 200 ema line can be used to detect longer term trend
[04:53] that is why these two can be the perfect combination for this strategy i'm using the default settings of the super trend indicator this is how you trade the strategy so you only take buy signals from the super
[05:07] trend when the price is above the 200 ema line and you only take sell signals from the indicator if the price is below the 200 ema line let me give you an example in this chart
[05:21] we can see that the super trend gave a buy signal line so we don't want to take positions yet once the price crosses above the 200 ema line
[05:35] while the super trend is still colored green that is the time where you want to green that is the time where you want to take a buy position super trend turns red let's move on to another chart
[05:53] indicates a sell signal but the price is still above the 200 ema so we don't want to take positions yet now once the price is below the 200 ema
[06:05] while the super trend is colored red that is where you want to take a cell that is where you want to take a cell position
[06:17] so this is where you want to close your position with the super trend is with the kumo cloud so the kumo cloud
[06:30] indicator that you disabled all the parts except the two lead lines and i'm also going to change the color so that it's easier to look at so now we have the komo cloud the rules
[06:46] of the kumo cloud is very simple if the price is above the kumo cloud you only take buy signals and if the price is below the kumo cloud you only take cell signals but
[07:00] don't take any positions let me give you an example in this chart we can see that the indicator gave a buy signal
[07:13] but the price is still below the clouds so you don't want to take positions yet next you can see that the price is inside the clouds so you also don't take any positions here
[07:27] next you can see that the price is above the clouds while the super trend is colored green so this is where you want to take your buy position and it's exactly the same for our sell
[07:40] signal as well we only take cell positions if the price is below the clouds and the super trend is colored red
[07:53] this the first one is you can set a take profit or a stop loss so you close your trade if it reaches a certain amount of profit or loss you can also close your trade if the
[08:06] price crosses over the clouds like in this example you can see that the candle closed inside the clouds so you can close your inside the clouds so you can close your position here
[08:22] and effective super trend strategy that is perfect for beginners and if you want more indicator secrets and strategies that no other channel teaches because we upload new strategies like this
[08:36] every single week so thank you guys for watching and i'll see you in the next watching and i'll see you in the next video




⚡ Saved you 0h 08m reading this? Transcribe any YouTube video for free — no signup needed.