
Heikin Ashi Doesn't Show Real Price!
43sReveals a common misconception that could mislead traders, sparking curiosity and debate.
▶ Play Clip"Delivers solid strategies but includes a lengthy subscribe plea and some filler; title is mostly accurate."
This video presents two practical trading strategies using the Heiken Ashi indicator, focusing on trend identification and reversal detection. The presenter emphasizes actionable techniques over theoretical background, aiming to help traders filter market noise and improve entry timing.
The video skips the founder and formulas, focusing on strategies. Heiken Ashi candles do not show real prices; they smooth price action to reduce noise.
Heiken Ashi candles display a smoothed version, not the actual price. For backtesting, use the 'Heiken Ashi' indicator on a chart with real candles to see both.
Real trends are often messy with mixed candle colors. Heiken Ashi makes trends clearer by showing same-colored candles, helping traders identify direction in real time.
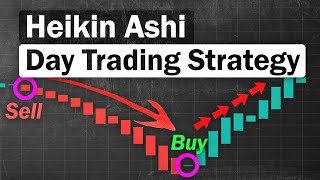
A strong bullish trend: green candles with large bodies and no lower shadows. A strong bearish trend: red candles with large bodies and no upper shadows.
Doji candles (small body, two shadows) signal potential reversals. Steps: find existing trend, find a doji, wait for two opposite-colored candles with one shadow each, then enter.
In a downtrend, a doji appears, followed by two large green candles with one shadow, signaling a buy. In an uptrend, the opposite signals a sell.
Stochastics identifies overbought/oversold conditions. However, using it alone leads to false signals. Combine with Heiken Ashi for confirmation.
Look for overbought/oversold points where Heiken Ashi hasn't shown strong momentum yet. Avoid entries after price has already moved significantly.
When stochastics is oversold but price hasn't dropped much, it's a good buying opportunity. The volume to the downside is low, increasing reversal probability.
The Heiken Ashi indicator, when combined with proper trend and reversal analysis, can significantly improve trading decisions. Adding stochastics as a confirmation filter helps avoid false signals and enhances entry timing.
What does a Heiken Ashi candle represent?
A smoothed version of price action, not the real price.
00:29
What are the criteria for a strong bullish trend in Heiken Ashi?
Green candles with large bodies and no lower shadows.
02:04
What is a doji candle in Heiken Ashi?
A candle with a very small body and two shadows.
02:41
What is the first step in the reversal detection strategy?
Find an existing trend.
02:55
After finding a doji, what signal confirms a reversal?
Two candles of the opposite color of the trend, each with only one shadow.
03:09
Why should you not rely solely on stochastics for entries?
It leads to many false signals.
04:51
What is the ideal entry condition when combining stochastics and Heiken Ashi?
Overbought/oversold levels where Heiken Ashi hasn't shown strong momentum yet.
05:19
Heiken Ashi filters noise
Explains the core benefit of the indicator: clearer trend visibility.
01:38Strong trend criteria
Provides clear, testable rules for identifying strong trends.
02:04Reversal confirmation
Gives a specific pattern for entry signals, improving reliability.
03:25Stochastics combo logic
Shows how to filter false signals by combining indicators.
05:19[00:02] strategy that you can use with the haiken ashi indicator so explaining the unimportant stuff like the founder or the formulas of the indicator because that's not going to make you money
[00:16] instead we are going straight to the point and the strategies so first of all let me clear things up for the beginners out there that is still new to this indicator the hike in ashi candles does not show
[00:29] the real price like you see in this example here i'm using the hiking ashi candle and it displayed a wide green candle candlestick it just displays a small candle so
[00:45] when you're back testing the haiken ashi strategy you cannot set your candles to hike in ashi because it's not the real price instead called haikenashi which is going to show you the original
[00:58] price and the haiken ashi candles now that's out of the way let's continue with the strategy so when trading finding a trend isn't as simple as you think a trend doesn't normally look like this
[01:13] [Music] most trends actually look like this well in hindsight this may look easy but if you're trading real time these
[01:25] different colored candles will confuse you and might give you false signals so instead of looking at these annoying candles that might display false signals using the haikenashi you would instead
[01:38] see all the candles with the same color so it's easier to identify the trend real time that's what the haiken ashi is it can help eliminate noises and shows a more clear view
[01:50] of the market's direction so here's a quick way on how to identify the current trend using the haikanashi chart you can identify a strong bullish trend if the candle is colored green
[02:04] it has a large body and it has no lower shadows trend if the candle is colored red it has a
[02:16] large body and it has no upper shadows so we all know that a trend will not last forever eventually it'll start to weaken and reverse
[02:29] designed to detect price reversals so in a high kenashi you will also encounter doji candles like this
[02:41] so a doji candle is when a candle has a very small body and two shadows here's how you find reversals chart the first step is to find an existing
[02:55] the next step is to find a doji candle within that trend the doji can be in any color as long as it's a doji candles that is in the opposite color of the
[03:09] trend to appear like in this example in this chart we have an existing uptrend and a doji candle so what we want to do color of the trend in this case a red candle to appear
[03:25] two times and both of the candles need to have only one shadow case we take a sell position
[03:42] you can see the price is on a clear downtrend and the doji candle appears next you can see two huge candles with one shadow that is in the opposite color of the trend in this case
[03:55] signal to take a buy position [Music] so that's how you use the high kanashii candles to detect reversals the next strategy that i like to utilize
[04:10] when trading the haiken ashi is by combining it with the stochastics so i'm not going to go in depth with the simple and i don't want this video to be too long
[04:23] so basically it's exactly like the rsi if the lines crosses below the lower bands meaning the market is oversold and more likely to reverse upwards and if it crosses above the upper bands
[04:38] meaning the market is considered overbought and is more likely to reverse downwards but when trading the stochastics indicator you cannot take positions solely based on if the price is overbought
[04:51] and oversold alone because if you're using the strategy this way it can lead to many false signals like in this example if you follow every signal that the stochastics display
[05:03] you will face unnecessary losses instead we need to add a second confirmation indicator like the haiken ashi to further confirm our analysis so here's how you trade the haiken-ashi plus stochastics indicator combination
[05:19] so you want to find overbought and oversold points where the heiken ashi hasn't yet displayed a strong momentum let me give you an example here you can see the stochastics went to oversold
[05:32] but the price has already dropped significantly so we do not want these types of entries because the price has already established a strong downwards momentum instead we want something like this
[05:47] levels but the price hasn't yet established a strong downwards movement therefore it is more likely to reverse to the upside so let's look at another example here
[06:03] from overbought to oversold levels but in the process downwards the downside so this is also a good opportunity to
[06:19] so this is also a good opportunity to take a buy position you can see the stochastics is at the oversold levels
[06:31] yet the price hasn't yet established a strong downwards momentum so the volume to the downside is very little therefore this will be a good buying opportunity
[06:43] [Music] so i just revealed to you the best haiken ashi indicator and all i ask for in return is a very small favor of
[06:56] liking the video and subscribe to the channel it literally takes only two clicks and it means a lot to me and in return you'll get notified when i post more high quality trading videos like this
[07:08] so thank you guys for watching and i'll see you in the next video




⚡ Saved you 0h 07m reading this? Transcribe any YouTube video for free — no signup needed.