
AI Summary
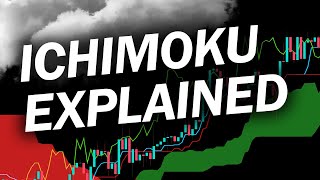
This video provides a concise, under-10-minute explanation of the Ichimoku Cloud indicator, focusing on practical usage techniques rather than calculations. It breaks down each component—conversion line, baseline, leading spans, and lagging span—and demonstrates how to combine them for trading signals, including cloud-based stop-loss placement and several strategy variations.
Chapters
The Ichimoku Cloud is an indicator that shows trends and momentum, but unlike MACD, it filters out range-bound market noise using the Kumo cloud.
The blue conversion line (Tenkan-sen) acts like a fast moving average, sensitive to price, identifying short-term trend. The red baseline (Kijun-sen) is slower, identifying longer-term trend. Crossovers signal trades: blue crossing below baseline = short, above = long.
The Kumo cloud, formed by leading spans A and B, filters noise and shows trend direction. Green cloud (span A above B) indicates strong upward momentum; red cloud indicates downward momentum. Rules: price above cloud = only long signals, below = only short, inside = no trades.
For a long: price above cloud and baseline, conversion line crosses above baseline. For a short: price below cloud and baseline, conversion line crosses below baseline. Avoid trades when price is inside the cloud.
Optional second confirmation. If lagging span is above price and heading upwards, confirms strong uptrend; if below and heading downwards, confirms downtrend.
The presenter suggests using a TradingView indicator by 'skyrock signals' to simplify signals, making it easier to identify entries. Also, the cloud can be used for stop-loss placement: set stop-loss just below/above the cloud, and close if price breaks through.
Simple strategy using only conversion line and baseline: long when conversion crosses above baseline, short when it crosses below.
Take long when price crosses above the cloud, short when price crosses below the cloud.
Kumo cloud can be combined with Chaikin Money Flow (long when CMF above zero and price above cloud; short when CMF below zero and price below cloud) and Parabolic SAR (long when SAR below candles and price above cloud; short when SAR above candles and price below cloud). Avoid trades inside cloud.
The Ichimoku cloud is versatile and can be combined with other indicators. The presenter advises that you don't have to follow original rules; test and find winning techniques that work for you.
The Ichimoku Cloud is a versatile trend and momentum indicator that, once understood, can be effectively combined with other tools to generate trading signals and manage risk. The key is to practice and adapt the rules to your own trading style.
Mentioned in this Video
Tutorial Checklist
Study Flashcards (8)
What does the Ichimoku Cloud indicator show?
easy
Click to reveal answer
What does the Ichimoku Cloud indicator show?
It shows trends and momentum on the market, filtering out range-bound noise using the Kumo cloud.
00:29
What is the role of the conversion line (Tenkan-sen) in Ichimoku?
easy
Click to reveal answer
What is the role of the conversion line (Tenkan-sen) in Ichimoku?
It acts like a faster moving average, more sensitive to price action, and is used to identify the short-term trend.
01:27
What does a green Kumo cloud indicate?
medium
Click to reveal answer
What does a green Kumo cloud indicate?
A green cloud, formed when leading span A crosses above leading span B, indicates strong upward momentum.
02:32
What is the rule for trading when the candle is inside the Kumo cloud?
easy
Click to reveal answer
What is the rule for trading when the candle is inside the Kumo cloud?
You don't take any positions when the candle is inside the cloud.
03:00
How can the lagging span (Chikou span) be used for confirmation?
medium
Click to reveal answer
How can the lagging span (Chikou span) be used for confirmation?
If the lagging span is above price and heading upwards, it confirms a strong uptrend; if below and heading downwards, it confirms a downtrend.
03:54
What is the baseline crossover strategy?
medium
Click to reveal answer
What is the baseline crossover strategy?
It uses only the conversion line and baseline: go long when the conversion line crosses above the baseline, short when it crosses below.
05:32
How can the Kumo cloud be used for stop-loss placement?
medium
Click to reveal answer
How can the Kumo cloud be used for stop-loss placement?
Set stop-loss just below the cloud for long positions and just above for short positions; close if price breaks through the cloud.
05:02
What is the cloud crossover strategy?
easy
Click to reveal answer
What is the cloud crossover strategy?
Take long positions when price crosses above the cloud, and short positions when price crosses below the cloud.
05:57
💡 Key Takeaways
Ichimoku filters range-bound noise
This is the core differentiator from MACD, explaining why the indicator is useful in ranging markets.
00:29Cloud color indicates momentum
Green vs red cloud provides a quick visual cue for trend strength, a key practical tip.
02:32Cloud position rules
Clear rules for when to trade (above/below) and when to avoid (inside) are essential for risk management.
03:00Cloud as stop-loss guide
Using the cloud for stop-loss placement is a practical risk management technique that many traders overlook.
05:02Adapt the indicator to your style
Encourages traders to test and customize rules, promoting a data-driven approach rather than rigid adherence.
07:53Full Transcript
[00:03] you need to know about the ichimoku cloud indicator in less than 10 minutes and as usual i'm not going to waste your time calculations of the indicator this video is purely about explaining
[00:17] the different techniques and how to use the indicator so that you trading arsenal right after watching this video so without further ado let's get started so the ichimoku cloud
[00:29] is an indicator that shows trends and momentum on the market however unlike a normal momentum indicator like the macd crossover the market is on a range the ichimoku cloud instead filters them
[00:44] out using what's called the kumo cloud we'll get to that in a minute so if you search ichimoku indicator on tradingview you'll get this a bunch of messy lines so at first glance the ichimoku indicator may look messy and complex
[01:00] but it's actually very very simple once you know how to use it so let's break down the parts so to make it simple conversion
[01:12] cankinson and the baseline which is also known as the kijunsen so these two lines acts very similar to a moving average crossover the blue line acts like a faster moving
[01:27] average it is more sensitive to price action and is used to identify the short-term trend and the red line acts like a slower moving average it is less sensitive to price action and
[01:40] can be used to identify a more longer term trend direction so the way we combine these two lines is if the blue line crosses below the baseline it means you take a short position and
[01:54] baseline you take a long position next we have these two lead lines or also known as the senkus bands
[02:06] kumo cloud so the kumo cloud is what stands out in the ichimoku indicator because it can help filter out noises while still displaying trends usually when the price is on a trend the
[02:20] cloud will also heading towards that direction for example if the price is on a strong bullish trend the direction of the cloud will also follow upwards the color of the clouds can also
[02:32] trend if the cloud is colored green which is formed when leading span a crosses above leading span b this indicates that the price is on a strong upwards momentum
[02:45] and if the cloud becomes a red color which is formed when leading span a leading span b it indicates that the price is on a strong downwards momentum so the kumo cloud has a couple of rules if the candle is above the cloud
[03:00] if the candle is above the cloud you only take long signals only take short signals and if the candles are inside the cloud you don't take any positions
[03:15] so now we combine all of them together if the price is above the clouds and the baseline you take a long position
[03:27] it's the same thing with a short position when a candle is below the and the conversion line crosses below the baseline the baseline you take a short position and remember
[03:39] do not take any trades if the price is inside the clouds lastly we have the lagging span or also known as the chiku span so the lagging span is optional some traders use it some traders don't
[03:54] the lagging span can be used as a second confirmation for a trend for example let's say you receive a bullish signal from the ichimoku cloud the lagging span can help confirm that that is a strong bullish signal
[04:09] upwards this further confirms that the price is on a strong uptrend and it's the same with downtrends as well if the lagging span is heading downwards
[04:22] this further confirms that the price is on a strong downtrend so even though you already know how to use the ichimoku indicator i can guarantee that most of you will still make mistakes when trading it
[04:35] because the indicator looks so messy so i suggest this indicator on tradingview by skyrock signals bearish signal appears by giving signals like this so now
[04:49] it's a lot easier for us to know when to enter long or short positions you can also use the clouds to determine your stop loss for example if the ichimoku displays a
[05:02] short position you can set your stop loss right below so if the price breaks through the clouds you close your position this can be used as a safety if the price reverses to the other direction
[05:16] so that you can close your trade early and avoid losing a lot of money next let's talk about the different types of strategies that you can use when trading the ichimoku cloud so the first we have the baseline
[05:32] crossover strategy the baseline crossover only uses the conversion line and the baseline if the conversion line crosses baseline if the conversion line crosses upwards you take a long position
[05:45] and if it crosses downwards you take a short position cloud crossover so in this strategy you simply take long
[05:57] positions if the price crosses above the clouds and you take short positions if the price crosses below the clouds the kumo cloud can also be used to combine with other indicators
[06:10] and it can act as a baseline to see the overall trend direction for example the chicken money flow and the kumo cloud combination so you take long positions if the tchaikon money flow
[06:24] closes above the zero line while the candle is still above the kumo cloud money flow crosses below the zero line and the price is still below the clouds
[06:42] indicator such as the parabolic sar so actually i already traded this indicator combination 100 times in my other videos
[06:54] so be sure to check that out as well so how this works is you basically take long positions if the parabolics are is below the candles while still being above the clouds and you take short positions when the
[07:10] parabolic sar is above the candles while the candle is below the clouds and don't take any positions if the and don't take any positions if the candle is inside the clouds
[07:25] add the lagging span to further confirm the overall trend direction displays a long position while the lagging span is heading upwards that is a good sign that the price is on
[07:38] an uptrend so overall the ichimoku clouds is one of those indicators that you can easily combine with other indicators current trading strategy and my tip for you is just because a
[07:53] doesn't mean that's the only way to use the indicator you don't need to follow the original rules of the indicator if you test out you may find winning techniques that you can use for a lifetime
[08:06] testing process looks like you can check out my other backtesting videos as well so i just showed you the different ways implement right now and all i ask for in return is a very
[08:21] subscribe to the channel it literally takes only two clicks and so thank you guys for watching and i'll see you in the next video



