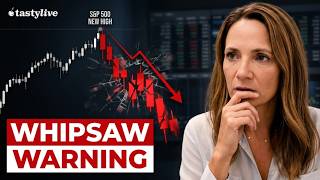

S&P 500 New Highs: Breakout or Trap?
45sThe host and guest discuss the market hitting new highs, creating immediate intrigue and a 'what happens next' hook for viewers.
▶ Play Clip"Title accurately reflects the discussion on the S&P's new high and whipsaw risk—delivers exactly what it promises."
In this Tasty Live interview, technical analyst Katie Stockton discusses the S&P 500's recent new high and the need for confirmation to avoid a whipsaw. She analyzes July's market correction, sector rotation, and the outlook for gold and Bitcoin.
The S&P 500 cleared final resistance around 7620, but confirmation requires a solid close above that level and ideally in the upper half of the day's range.
July's correction was driven by a loss of momentum, signaled by the 20-day moving average rolling over for semiconductor stocks, and exacerbated by high-beta, unproven companies.
Weekly momentum indicators show negative divergences, such as in MACD, suggesting the rally could give way to a whipsaw, where immediate upside follow-through often fails quickly.
Equal-weight proxies like RSP and TAC made new highs in July even as the S&P 500 floundered, indicating healthy breadth and sector rotation away from technology.
Energy was the best performing sector in July, up more than 12%, while financials and healthcare showed relative strength, creating a tug-of-war with technology.
Mega-cap tech moves are now more earnings-driven than macro-driven, with Microsoft showing a breakout and Alphabet an oversold upturn on weekly charts.
Longer-term bias is neutral due to signs of upside exhaustion on monthly charts, leading to expectations of a choppier, more volatile second half of the year.
Gold's relief rally is counter-trend after breaking below its Ichimoku cloud, while Bitcoin holds support between $58,000 and $60,000, with signs of a basing phase.
What confirms a short-term breakout for the S&P 500?
A solid close above 7620 and ideally in the upper half of the day's range.
01:03
What signaled the loss of momentum in July?
The 20-day moving average rolling over for semiconductor stocks.
02:24
What is a whipsaw in technical analysis?
A whipsaw is a rare event where immediate upside follow-through often fails quickly, making the breakout less lasting.
04:13
Which sector performed best in July?
Energy was the best performing sector in July, up more than 12%.
07:49
What did equal-weight proxies like RSP and TAC do in July?
They made new highs while the S&P 500 floundered, showing healthy breadth.
05:32
Why is gold's relief rally considered counter-trend?
Gold broke below its Ichimoku cloud, suggesting a prolonged down cycle.
12:35
What is the key support level for Bitcoin?
Support is between $58,000 and $60,000.
13:03
Breakout Confirmation Criteria
Provides a clear, actionable rule for traders to confirm a breakout, reducing false signals.
01:03Positive Divergence in Equal-Weight Proxies
Highlights how breadth can signal underlying strength even when headline indices struggle.
05:32Using 20-Day Moving Average for Momentum
A simple, effective tool for early detection of momentum loss, as demonstrated in July.
02:24Gold's Counter-Trend Rally
Explains why a relief rally may not signal a trend reversal, using Ichimoku analysis.
12:35Choppy Environment Ahead
Warns that upside exhaustion indicators suggest more volatility, not a bear market.
11:10[00:00] Welcome back. You're watching Tasty Live. This is another edition of Live Trading Trends. We have an excellent guest here today because the charts are certainly beginning to evolve, so to speak.
[00:17] You've probably seen her on CNBC before. She's the CEO and founder of Fairleaf Strategies based right down the street from me in Greenwich, Connecticut. It's Katie Stockton. Welcome to Tasty Live. Thank you so much, Chris. Good to be with you all.
[00:29] So right now we have a day where the S&P 500 was pushing new highs. The market's come in a little bit here today. But it looks bullish on the surface because new highs attract momentum and they force underinvested traders to chase,
[00:41] particularly after what was a rough two months here. When you see the S&P 500 at new highs right now, what does your work say? Confirmation of the bull trend? Or is this a market that needs more digestion after what's been a ripping week?
[00:53] Well, I would definitely emphasize confirmation. and it's something that we're looking for from the market because with any kind of breakout, you want to see it hold on to it for more than a day, and it is brand new indeed.
[01:06] As of yesterday, the S&P cleared final resistance, which is right around 7620. So assuming we get a solid close above that level today and ideally in the upper half of today's range, that will confirm a short-term breakout.
[01:21] And like you said, new highs are generally bullish and tend to foster additional upside momentum when you have a breakout, especially from a range. And the good news from that is that we could see a nice recovery from the areas of the market
[01:35] that did lead on the downside in July, which, of course, is a pretty rough month for a month of technology. July was an awful month for the month of technology,
[01:47] July usually being a good month for the market seasonally speaking. I know a lot of folks went into July thinking 11 for 11. and what could go wrong. What went wrong last month in the market that was so difficult, and why were we able to snap back so quickly here at the start of August?
[02:01] Well, it does seem somewhat headline-driven, and the charts will never really answer why something is happening, unfortunately, but it certainly will tell you what is happening in terms of the dynamics between supply and demand and market sentiment,
[02:14] which are really truly the driving forces after all. But in July, I think what we saw was just the first notable loss of momentum in months, And what we were using at the time to measure that, it actually started to roll over ahead of the corrective action in July.
[02:30] It was the 20-day moving averages, really simple trend-pulling device. They started to roll over the 20 days on a short-term basis for the likes of semiconductor stocks, which had exhibited upside leadership.
[02:44] So I think it was the loss of momentum, which is pretty much the obvious takeaway, right, but also the loss of leadership and relative performance from the AI trade, which we knew was so important to market sentiment.
[02:56] And then, of course, it gets exacerbated by the fact that these are high-beta stocks, some of them very much unproven companies, and the retracements could be really dramatic in that kind of scenario.
[03:08] But even for the large-cap gross names that are very solid companies, something like O'Kane, for example, had really, really extreme retracements. And with that, of course, now we have an oversold condition
[03:22] and that could be contributing to the rebound that we seeing When we think about this security issue of momentum obviously momentum can continue a very long time in a healthy market It can stay overbought right now When momentum doesn continue to the upside and the market making new highs it usually catches my attention
[03:38] Has momentum officially reignited from your perspective? On a short-term basis, we do have some bullish crossovers, but that's on the daily chart. On the weekly chart, it's a little bit confused right now.
[03:52] that we had a loss of momentum that was pretty meaningful. We even have some negative divergences out there in the weekly momentum indicator, things like the MACD indicator. But this rally has the potential to give way to a whipsaw.
[04:06] So whipsaws are really pretty rare when it comes to these smooth market timing devices. And they just try to pay attention. And that's, of course, what we're doing right now, this breakout, deciding whether it's real after today or tomorrow's trading.
[04:20] and with the whipsaw you can see immediate upside follow through but it often isn't a lasting development. They tend to sometimes fail pretty quickly. So we're looking at this as the breakout is confirmed as we would expect to be more of a short to intermediate term development that's bullish
[04:38] as opposed to something that means that we have the cyclical uptrend entering a new wave. One of the particularities of this market throughout the month of June and July was the fact that you didn't really have a breakdown in the broader markets.
[04:53] The NASDAQ obviously had some trouble at the headline index level. The SMH was underwater. But when you look at something like RSP, the equal weighted, it kept just grinding higher. I know that Fairly now has a new sector tactical ETF, TACK, here,
[05:07] which is effectively equal weighted as well. Why is this an important signal for traders to pay attention to? I feel like sometimes when I talk to some of my coworkers, you see the Russell and RST holding up?
[05:19] Not a bad sign for the broader markets. Calm down. I get these funny faces. Well, it is really interesting because we saw a positive divergence for those equal weight proxies, including RST, including TAC, with the S&P in July.
[05:34] So we saw new highs from TAC, and we didn't see that new high yet from the S&P 500. And that's an environment in which we have sector rotation that we're honestly not accustomed to of late, right?
[05:47] We've had very concentrated leadership from technology. But thankfully, because when technology lost the leadership stronghold that it had, there were other sectors to kind of pull up some of that frag.
[06:00] And that's why you saw the equal weight proxies generally grind higher, even to new highs, as the S&P 500 kind of floundered with its big tech-heavy exposure. I think it raises up to 34%, 35% of the index.
[06:15] And, of course, equal weight proxies are much different in how they're balanced. So it was interesting. The breath was actually pretty healthy throughout it. So that was a contributing factor. There are other sectors that have some size to them.
[06:30] Financials, for one, actually had some relative performance that seems to be fading a bit. So we do track the sector rotations very closely, and we usually expect technology to outperform when we run these early-stage rallies,
[06:45] and we focus on it for a loss of momentum as well when we think things are fading. I like paying attention to sector leadership because it can kind of tell you where you are in the economic cycle in the bull bear cycle if you will Some things perform better than others during periods of time I mean tech leadership is saying one thing I can think of Staples and the way that retail ETFs have moved in recent sessions
[07:06] They may be saying another. What sector is giving you the cleanest read on leadership right now? And I ask that almost perhaps as a two-part question. I recall last year watching CNBC, Bloomberg, et cetera,
[07:19] and so much of the complaining about the market was it was all concentrated in the Mag 7. This year, the MAG7 hasn't done much of anything for the broader indexes. So who's really in charge right now? Well, like I said, during up markets, it tends to be technology, but that has not been the case.
[07:36] So during the corrective period, we saw the best relative performance from financials, from health care, for some segments of it, from energy. energy was the best performing sector in tech in July, up, I think, more than 12% for obvious
[07:53] reasons, right, with the crude oil influence and headlines. So there is sort of a tug of war, I think, in a way sometimes between energy and technology just based on the headlines.
[08:05] So that might determine, you know, how long-lasting tech-related performance is and how long-lasting and perhaps also the immediate upside policy that we've seen from this breakout will be.
[08:17] But right now we're mostly equal weight the sectors because we feel that there's a transition underway. So technology has lost upside momentum in a pretty meaningful way when you compare it to the S&P 500.
[08:33] So while we would expect short-term upside leadership from the breakout, out, we would also expect that loss of momentum to give way to a much choppier second part of the year. So we're not looking for that same concentrated upside leadership to persist in the way it
[08:49] stood off of the March-April low period. So it'll be interesting to see how it unfolds. We're also at the moment not looking for substantial outperformance in the life of consumer schools or REITs or utilities.
[09:04] They might do a little bit better with yield points to pull back. But that doesn't mean you can't find some great setups in absolute terms. So if we're talking about a performance, that's one thing.
[09:16] But there's a lot of nice-looking charts out there. And with this up move over the past week or so, we do have a lot of breakouts, as you can imagine, from a bottom-up perspective. AMGEN would be one that I just stumbled on today as having a breakout pending confirmation that's pretty clean on the chart.
[09:35] So it'll be interesting to see if these are confirmed. The MAG7 has kicked back in also over the past couple of weeks, and it seems to be less instilled by top-down macro forces and more about their earnings and reactions to their earnings reports.
[09:53] So we're constructive on most of the mega caps, not all of them, somewhat for different reasons from a technical perspective. As an example, Microsoft has a breakout, whereas Alphabet has an oversold upturn on its weekly chart.
[10:09] So different setups, but both positive from a technical perspective. So we're practicing this as technicians, right? I'm not a CMT, but I have the John Murphy book right here by my side almost every day,
[10:22] but almost monthly for the past 15 years. I think of the idea that we try to be agnostic to what on our screen here A chart is a chart is a chart But when we think about the risks that are coming up here we have the Fed of course purpling the Iran war we have midterm elections coming up
[10:37] How does that calculate or add to the calculation of your thinking about the risks over the next few months? Well, we are more neutral in our longer-term buyers, including, say, like six-plus months. And it's not about the forthcoming events that you cite.
[10:52] For us, it's really from a technical perspective in that we have on the monthly bar charts, you can see the secular and cyclical bull trends are very much intact for the major indices.
[11:05] But there are some indicators that show signs of exhaustion. It doesn't mean we move into a bear cycle, but it does likely mean that we have more choppy environments ahead. And July and to some degree June might be the beginnings of that.
[11:21] So we are working for more choppiness, more volatility for the second half of this year. We think it's already begun. And a lot of that comes from those signs of upset exhaustion. We're using the mark indicators to that end.
[11:36] But you can also just look at the prolonged overbought reading and check that perhaps, you know, the statistics as a downtick for the NASDAQ 100, that might become an issue. So not necessarily an imminent issue for the market,
[11:49] but something that differentiates it from the earlier phases of the cyclical bull. Sure. Before we go, and I do have one more question here, I can't help but notice on a day like today, gold is finally starting to get its groove back here,
[12:02] whereas Bitcoin is still somewhat struggling throughout this environment in this case right now. It's up half a percent here. I know that you guys have also likewise launched a new Bitcoin ETF BNAV here.
[12:14] Why is Bitcoin having so much difficulty trying to capitalize on this environment, whereas gold may not be. It's actually facing a little bit of a lighter step in its shoes these days. Yeah, so there's stabilization, I would argue, for both.
[12:29] For gold, the bullish action over the last really two days is somewhat promising, and it has a belief rally, it seems, underway that could persist. But at the same time, gold did break down recently below what we call our cloud model,
[12:45] so Ichimoku for those that are tracking it more closely. and that suggests that gold has entered, leaving it a more prolonged down cycle. And with that in mind, we view the relief rally as counter-trend.
[12:58] For Bitcoin, it's a big difference, but it has been bumping along the bottom. Important support for Bitcoin goes from about $58,000 to $60,000. It has been holding that level longer term. And if you look at the monthly gauges, there certainly are some signs of improvement
[13:14] to suggest that we might have a basing base underway. Our Bitcoin ETF being out is tactical, so we're taking a greater position when the momentum is at its best across time horizons.
[13:27] And we don't have that quite yet, but the way it's setting up, it looks like we could be using that leverage soon. Katie, this was a great conversation. I always love having someone on the network who likes to talk talks, so hopefully we can have you back again at some point in the future.
[13:42] She's been Katie Stockton, the CEO and founder of Fairlead Strategies. you can always see her on CNBC Bloomberg I've seen her around quite a bit over the past year so it's a pleasure to finally speak to you in person Thank you Chris, take care, thank you



⚡ Saved you 0h 13m reading this? Transcribe any YouTube video for free — no signup needed.