
AI Summary
This video explains three practical applications of the 50-period Simple Moving Average (SMA) in trading: identifying market trends, acting as dynamic support and resistance, and signaling potential reversals. It uses chart examples to illustrate each use case and concludes by offering a free ebook for further learning.
When the market trades above the 50 SMA, it indicates an upward trend; trading below signals a downtrend.
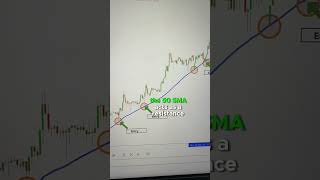
In an uptrend, the 50 SMA acts as support where prices bounce; in a downtrend, it acts as resistance pushing prices down.
A breakout below the 50 SMA in a strong uptrend signals a potential downtrend ahead.
The 50 SMA is a versatile tool for traders, offering clear signals for trend direction, support/resistance levels, and potential reversals. Mastering these three uses can enhance trading strategy.
Mentioned in this Video
Study Flashcards (3)
What does it indicate when the market trades above the 50 SMA?
easy
Click to reveal answer
What does it indicate when the market trades above the 50 SMA?
An upward trend.
00:02
How does the 50 SMA act in a downtrend?
easy
Click to reveal answer
How does the 50 SMA act in a downtrend?
It acts as resistance, pushing prices down.
00:31
What signals a potential downtrend in a strong uptrend?
medium
Click to reveal answer
What signals a potential downtrend in a strong uptrend?
A breakout below the 50 SMA.
00:45
💡 Key Takeaways
Trend Identification with 50 SMA
Provides a simple, visual rule for determining market direction.
00:02Dynamic Support and Resistance
Shows how the SMA adapts to price action, offering practical entry/exit levels.
00:17Reversal Signal via Breakout
Highlights a key warning sign for trend exhaustion.
00:45Full Transcript
[00:02] average to supercharge your trading strategy firstly it helps us identify the market Trend just take a look at this chart when the market trades above the 50 SMA it's a clear sign of an upward Trend conversely if it's trading
[00:17] below that indicates a downtrend secondly the 50 SMA acts as downtrend secondly the 50 SMA acts as Dynamic support and resistance see this chart when the market is above the 50 SMA it's a bullish signal prices tend to
[00:31] bounce off it making it a robust support level similarly in a downtrend the 50 SMA acts as a resistance pushing prices down lastly the 50 SMA serves as a
[00:45] reversal indicator check out this chart showing a strong uptrend how do we know it might reverse the breakout below the 50 SMA signals a potential downtrend ahead if you want to learn more download your ebook