
AI Summary
This video explores the investing principle that 'Time in the market beats Timing the market' through three levels of understanding. Using historical data and simulations, the creator demonstrates why holding cash (staying out of the market) reduces expected returns, and why a buy-and-hold strategy is statistically superior to attempting to time the market.
Chapters
Citing that missing the best days can ruin a portfolio. From 1995 to 2025, the S&P 500 averaged 10.96% annual growth. Missing the 10 best days drops returns to 7.92%, and missing 30 best days drops to 4.32%, barely above inflation.
If you could perfectly avoid the 50 largest down days, your 30-year annualized return would be 21.91%—Warren Buffett-level returns. However, predicting daily drops is impossible in reality.
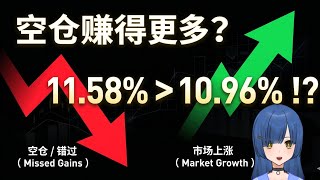
Backtesting that avoids both the 50 best and 50 worst days yields an 11.58% return, slightly higher than buy-and-hold's 10.96%. This is because volatility is reduced, decreasing the drag of market swings.
Stock prices are modeled as a geometric Brownian motion with drift (μ) representing long-term upward growth due to the economy, and diffusion (σ) representing short-term volatility. Avoiding extreme days in reality is unreasonable.
Generating 10,000 paths and simulating random cash days from 0 to 50 shows expected annualized returns linearly decline as days out of market increase. This reinforces the buy-and-hold strategy's effectiveness.
First level: Holding cash misses gains, so don't hold cash (mountain is mountain). Second level: Cash avoids losses, so the conclusion is doubted (mountain is not mountain). Third level: Random cash holding always lowers expected value, confirming the first level (mountain is mountain again).
💡 Key Takeaways
Missing the best days harms returns
Provides concrete data showing how missing even one best day per year drastically reduces long-term returns.
00:14Perfect market timing is unrealistic
Highlights the impossibility of predicting market crashes, contrasting theoretical returns with practical reality.
01:21Geometric Brownian Motion framework
Explains the theoretical basis for why markets trend upward over time, despite short-term volatility.
02:17Simulation proves buy-and-hold superiority
Provides robust evidence that randomly staying out of the market always reduces expected returns.
02:42Three levels of understanding
Summarizes the video's core message using a Zen-inspired framework, making the conclusion memorable.
03:28Full Transcript
[00:01] 今天分享一下我个人对于Time in the market beats Timing in the market,也就是躺在股市里的时间胜过在股市里择时的三层理解。
[00:14] 首先,华尔街一句耳熟能详的话是,错过涨幅最大的几天会毁了你的投资组合。 这里举一个例子 从1995到2025的30年间
[00:28] 标普500指数的平均年化增长率是10.96% 错过涨幅最大的10天 收益率就会降到7.92 而错过30天的话就会降到4.32
[00:41] 比通胀高不了多少 听起来错过30天很多 但要记住这是30年的数据 平均每年错过一天 你的收益率就和国债差不多了
[00:54] 这个简单甚至有点简陋的模型告诉我们 持币官网会错过上涨 所以不要留有多余的现金 当我第一次在网上看到这个结论的时候
[01:08] 我是不太相信的 因为股市有涨也有跌 持币官网不单会错过上涨 还有可能避开下跌 于是就有了下面的回测
[01:21] 如果你能精准地避开幅度最大的50次下跌 你的30年年化收益率将来到恐怖的21.91 这是和巴菲特一个级别的收益率
[01:35] 当然精准地预测明天会不会下跌 在现实中是不可能的于是我又回测了同时错过50个最大上涨和下跌的收益率这个结果很有意思收益率是11.58
[01:51] 比单纯的买入并持有的10.96稍微高一点点 这是因为我们排除了涨跌最大的一批数据 让整体的波动率下降了 减少了上下波动带来的损耗
[02:04] 那这个回测数据说明前面的第一层理解错了吗 并不是 我们需要更精确的模型 也就是第三层理解 一般我们可以认为
[02:17] 股价比较接近带飘移的几何布朗运动 这里的μ代表飘移向 它意味着从长期来看 股价是缓慢上涨的 这是经济增长所驱动的
[02:30] 而σ是扩散向 代表股价短期的波动 在前面的第二层理解当中 我们去掉的是涨跌幅最大的50天 这在现实中是不合理的
[02:42] 更合理的假设是随机选取空仓的日子 于是我生成了一万条路径 然后分别空仓0到50天 计算它们的平均年化 可以看到随着空仓时间的增加
[02:57] 期望收益率是直线下降的 这再一次证明了买入并持有策略的有效性 好,回顾一下今天的内容 第一层理解是空仓会错过上涨
[03:12] 所以不要空仓 这是看山是山 第二层空仓也会错过下跌 开始怀疑结论的正确性 这是看山不是山 第三层随机的空仓一定会降低期望值
[03:28] 这是看山还是山