
Bullish Engulfing Pattern That Actually Works
60sDemonstrates a specific, actionable trading pattern with a clear example, appealing to traders looking for proven strategies.
▶ Play Clip"Delivers on the promise of three patterns with clear examples, but the 'high accuracy' claim is unsubstantiated and the exit strategy is generic."
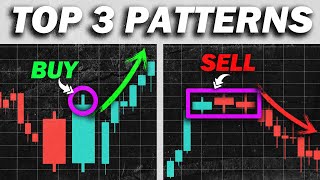
This video presents three high-accuracy candlestick patterns for forex trading: the engulfing pattern, the rejection candle, and shrinking candles. The presenter emphasizes the importance of combining these patterns with other price action methods like support and resistance for confirmation, and also shares a technique for exiting trades using the ATR indicator and momentum loss.
The engulfing pattern occurs when the second candle's body completely covers the first one. It should be used with support/resistance for confirmation. Example: after a downtrend to support, a bullish engulfing pattern signals a buy opportunity.
A rejection candle has a long wick on one side, showing strong rejection. It can be used at support/resistance to indicate reversals. Pro tip: the longer the wick, the stronger the rejection.
Shrinking candles get smaller as price approaches key levels, indicating momentum loss. A subsequent large candle confirms reversal. Example: small candles near support followed by a big green candle signal a buy.
To set a stop loss, use the ATR value of the entry candle (e.g., 59 pips). For take profit, watch for momentum loss (shrinking candles) and reversal candles to close the position.
If candles become directionless after a trade, it's a sign to close the position. Also, analyze candle behavior near major support/resistance.
The video provides practical candlestick patterns and exit strategies for forex trading, emphasizing the importance of combining patterns with support/resistance and using ATR for stop loss placement.
What is an engulfing pattern?
When the second candle's body completely covers the first one.
00:28
What is the pro tip for trading rejection candles?
The longer the wick, the better, because it indicates a strong rejection.
04:17
What do shrinking candles indicate?
A decrease in momentum as price approaches key support or resistance.
04:29
How do you set a stop loss using ATR?
Point your mouse on the entry candle and look at its ATR value; place stop loss at that distance (e.g., 59 pips).
06:53
What is the first sign to close a position based on momentum loss?
Candles getting smaller and smaller, indicating momentum loss.
07:33
Engulfing Pattern Definition
Core concept for the first pattern, clearly defined.
00:28Pro Tip on Rejection Candles
Actionable advice: longer wick means stronger rejection.
04:17ATR-Based Stop Loss
Provides a concrete method for setting stop losses.
06:24Momentum Loss as Exit Signal
Shows how to use candle behavior to exit trades profitably.
07:33[00:03] price action candlestick patterns that are proven to work and before i continue if you have any suggestions for future videos you can drop them in the comments below i'm still a small channel so i'll still
[00:16] have time to read and reply to all of the comments the video so the first pattern is called the engulfing pattern
[00:28] this happens when the second candle's body completely covers the first one so how do we use this pattern like i said before you cannot simply buy or sell just because a pattern appears
[00:41] you need to combine it with other price action methods like support and resistance to act as a second confirmation so over to the left we can see that prices went down to this point
[00:53] and reverses significantly making this a key support level again notice what's happening the candles are slowly getting smaller and smaller
[01:06] indicating momentum loss and finally a bullish engulfing pattern was formed because the second candle's body formed slightly above the first candle push the price downwards even at one point broke the
[01:23] resistance line but then the buyer starts coming in and started pushing the price back up surpassing the first red candle and if you want a stronger confirmation you can wait for the next candle to form
[01:37] you can wait for the next candle to form which happens to be another green candle so this is a good opportunity to take a buy position let's look at another example so again here you can see that prices went
[01:51] up to this resistance line then rejected it multiple times before reversing downwards now as prices go back to this level we can see a fakeout happening as prices push
[02:04] through the resistance level only to then come back down again pattern as the red candle fully engulfs the previous green candle so what this shows is that buyers failed
[02:18] to push the price upwards multiple times as sellers kept coming in at this area pushing the price back downwards so this is a good back downwards so this is a good opportunity to take a sell position
[02:36] easily predicted through the behavior of the candles now the next pattern is called the rejection candle shadow of a candle is significantly longer on one side
[02:51] showing a strong rejection in price here's an example of that so over here you can see price dips to this level before reversing making this a point of support now as prices went back to this level again
[03:08] we can see a huge price rejection in the form of a rejection candle so what this shows is that at one point the sellers push the price all the way breaking the support level then buyer starts coming in
[03:23] support level and for further confirmation the next candle after that is a big green candle which further confirms the reversal so this is a good opportunity to take a
[03:38] buy position so let's look at the rejection candle in action again so over to the left prices went up to this level of resistance then drops back down again now
[03:52] as prices went back to this level of resistance again starts getting smaller momentum
[04:04] plus a huge rejection candle indicating a strong selling pressure within this area of resistance so this is a good opportunity to take a cell position here's a pro tip when trading rejection
[04:17] candles the longer the wick the better because a indicates a strong rejection in that area
[04:29] shrinking candles so this happens when a candle is slowly getting smaller and smaller as it approaches a key support or resistance line indicating a decrease in momentum so
[04:41] let's look at an example of that so again here you can see prices went up and down again so we can draw a resistance line over here
[04:53] next as prices are heading to this level again again you can see a candle a smaller candle finally a very small candle with a long wick
[05:06] appears signaling an indecision in price now happening here but to further confirm our analysis
[05:18] we are waiting for a huge candle to form as shown here so this is a good opportunity to take a short position another chart so again over to the left we can see
[05:33] that prices went down then reverses back up again making this a key support level now as prices are heading to this level again we can see a big candle followed by a
[05:46] smaller candle followed by an even smaller candle approaching near support indicating a loss of momentum and then a huge green candle appeared signaling a strong
[05:59] buying pressure which further confirms the reversal pattern so this is a good opportunity to take a buy position remember you can tell a lot on what's happening in the market
[06:12] just by looking at the behavior of the candles itself enter a trade using price action and now i'm going to
[06:24] reveal the best technique to exit a trade so that you can get the maximum amount of profit as possible so let's start the first thing we need to do is to identify our stop loss
[06:39] so to find our stop loss we are using the atr indicator indicator before so be sure to check that out so first let's say i'm taking a cell position here
[06:53] so how we determine our stop loss is by looking at the atr value so what you need to do is point your mouse right on the candle where you want to enter the trade and look at its atr value
[07:07] in this case it's 59 pips so that's where you want to put your so that's where you want to put your stop loss at 59 pips now i'm going to show how you can place your best take profit target
[07:20] to get as much profit as possible and so for the strategy we are also using the concepts of momentum loss so here's an example of that let's say i took a short position here
[07:33] and as you can see the candles are getting smaller and smaller which indicates a momentum loss so this is the first sign that i'll be closing my position soon next you can see that the candles
[07:46] then reverses upwards because a big green candle appeared so based on the price action i can see that the momentum has shifted to the upside therefore i'll be closing my position here and taking
[08:00] be closing my position here and taking my profits when the price doesn't show a clear trend anymore like in this example so let's say i took a short position
[08:14] here so at first i can clearly see a downtrend here but then the next candles after that are directionless candles i'm having a hard time knowing where the
[08:27] market is heading so when this happens i'll usually close so when this happens i'll usually close my position is to analyze the behavior of the candles when it's approaching a major
[08:43] support or resistance line so i just revealed to you the best way patterns now all i ask for in return is for you
[08:55] to invest three seconds of your time into liking the video and subscribe to it literally takes only two clicks but it means so much to me quality trading videos like this every single
[09:09] week so thank you guys for watching and i'll see you in the next video




⚡ Saved you 0h 09m reading this? Transcribe any YouTube video for free — no signup needed.