

3 Green Boxes = Buy Signal!
53sThe core rule is simple and visual, making it instantly understandable and shareable.
▶ Play Clip"Title promises '100% accuracy sequences' and the video shows those streaks, but actual win rate is 85% — not fully misleading, though slightly oversold."
This video presents a Renko scalping strategy for the mini-index (WIN) that operates between 9 AM and 11 AM. The core idea is to trade based on sequences of three consecutive positive or negative Renko boxes, targeting 25 points per trade with a 200-point stop loss and a specific exit rule. The strategy boasts an 85% win rate in backtests with a profit factor of 1.49.
Three positive boxes in a row trigger a buy signal.
Three negative boxes in a row trigger a sell signal.
Target 25 points, stop loss 200 points, exit if a box closes at a loss.
The daily limit is 10 transactions.
Backtest from Jan 11 2024: 2480 trades, 85% success, profit factor 1.49, max drawdown 5%.
What triggers a buy signal in this Renko strategy?
Three consecutive positive boxes for a buy, three negative boxes for a sell.
00:43
What are the target and stop-loss levels used?
25 points target and 200 points stop loss.
01:39
What is the exit rule when a box closes at a loss?
If the target isn't reached in the first box and the box closes at a loss, exit immediately.
01:52
What is the daily trade limit?
10 trades per day.
05:35
What are the backtest statistics?
85% success rate, profit factor 1.49, max drawdown 5%.
07:17
When does the strategy operate?
9 AM to 11 AM.
05:47
Three-box signal
Simple, objective entry trigger that is easy to code and backtest.
00:43Exit signal avoids stop-loss hits
The time-based exit often prevents hitting the stop, preserving capital.
02:48Daily trade limit
Limiting trades per day can reduce overtrading and improve consistency.
05:35High win rate with modest profit factor
Shows that high accuracy can exist without a high profit factor, indicating small wins and occasional larger losses.
07:33[00:18] video on the channel. And today I want to share with you a setup for the share with you a setup for the 10R chart of the mini-index. This setup will work for buying and selling between 9 AM and 11 AM
[00:31] . But he'll have a limit of 10 transactions per day. I want to start by explaining to you how the buy signal for this strategy will work, which is quite simple. Whenever we have a
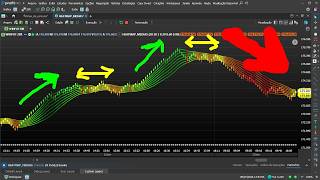
[00:43] sequence of three positive boxes here, three positive boxes in a row, then we have a buy signal and the strategy allows us to enter a market buy position at the opening of the next box, which we need to
[00:58] wait for to close. Once that box closed, we had confirmation of three positive cases in a row. So, we'll make the row. So, we'll make the purchase when the next box opens.
[01:12] in the scalpe model. Let's delve into the scalping model here, as you can see. So, I want to start by explaining to you how the target, stop, and exit signal organization will work to generate this
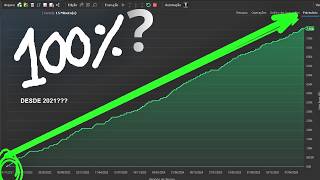
[01:26] capital curve that we're seeing here. As you can see in the backtest, this capital curve here, from January 11, 2024 to the present day, is the capital curve we obtained for the
[01:39] strategy. We're going to work here with a target of 25 points, a stop loss of 200 points, but we'll have an exit signal here, okay? The output signal will
[01:52] be as follows. If I enter a trade and the target isn't reached in the first box, and the target isn't reached in the first box, and the box closes at a loss, then I'll close the trade immediately, okay? So this 200-point stop here, it's
[02:07] mostly just visual, it's just so we have a visible stop here, right? But we're not going to exit the trade when we hit the stop loss. We'll leave earlier. For example, I came in here, and then this booth closed, causing a
[02:21] loss of 89 points. I'll end the transaction right here. When the next box opens , I end the operation. Okay, we're going to use an output signal. So this 200-point stop loss remains solely an
[02:35] emergency stop loss, right? Only if the market crashes very quickly, right? So it's already at that level of 200 points. But often we'll leave before that. We'll have a target of 25 points, a stop loss of 200 points, and if
[02:48] any box closes at a loss, I'll close the trade. So what do sequence of three positive boxes or three
[03:01] negative boxes. If we have a sequence of three positive boxes, then it have a sequence of three negative boxes, it will be a sell signal. Look, let's see here. Sequence of three positive boxes. Oh, you had a
[03:15] very clear sequence of three positive boxes here. When the next trading session opens, we enter a market buy position with a target of 25 points. He went there and hit our target. And there you have it again , 1 2 3, three positive boxes.
[03:32] We're still seeing the signal, right? We're going to keep entering again, look, at the opening of the next box, I'm entering the market with a target of 25 points, as you can see here, right? He went there and hit the target.
[03:47] Let's look at this again. We want a sequence of three positive boxing matches, like what happened here. three positive boxes. So, when the next trading window opens, I enter the market with a target of 25 points, a
[04:00] stop loss of 200 points, and the exit signal that I mentioned to you. Here again , he continues to give all three boxes positive. Even though I've already made this entry here, I'll do it again because the three
[04:14] positive boxes remain on the chart, right? So, I'm entering the market again here, with a target of 25 points. So, when the next box opens, I'll go back to the market because I still have three device boxes here, look. I still
[04:28] have three positive boxes. So I'm going back into the market. Oh, I hit the mark here. I continue to have three positive boxes on the graph. So I'll continue going into the purchase. Oh, it hit here. I continue to have three
[04:41] positive boxes on the graph. Three positive boxes here, look. I will continue entering the purchase until a negative box appears
[04:54] . Three positive boxes in the graph. I'm going to buy it. I came in here. It still has three positive boxes, look. I'm going to buy again. I came in here.
[05:07] here, right? An excellent sequence. This is strategy, right? That's why this strategy has a high success rate, right? This is roughly an 85% accurate rate. Often, you'll follow sequences of
[05:20] 100% accuracy, right? Like this sequence here. The pattern continues as shown in the chart. So, again, oh, it came in here. But here's important to make clear in this strategy. She has a limit of 10
[05:35] transactions per day. She has a limit of 10 transactions per day. So, as soon as she reaches 10 trades in a day, she stops trading. And in sales it will be the opposite. In the sale, we're
[05:47] going to look for three negative boxes here . How was it here? Here you had a sequence of three negative boxes within the strategy's operating hours, which runs from 9 AM to 11 AM.
[05:59] So, when the next trading window opens, we enter a market sell position with a target we enter a market sell position with a target of 25 points and a stop loss of 200 points, ending up more or less here. And the exit signal I mentioned to you is that if
[06:12] the target isn't reached immediately in the entry box, and loss, then we close the trade before hitting the stop loss. But in this case, she hit the target, so there was no need to signal her to leave.
[06:28] Let's look again, okay? Look, three negative boxes. We will enter the market sell position at the opening of the next trading session with a target of 25 points. And the pattern continues to happen, oh. Three negative box positions, market sale, target of 25 points.
[06:44] market sale, target of 25 points. Let's look at this again. Three negative boxes, sale at market, target achieved. We continue with the pattern in the chart. There are three negative boxes. Market sale, target achieved. It
[06:59] 's still here, look. Three negative boxes. Market sale. Target hit. Three negative boxes. Continues selling, target hit. It continues to sell because there are still three negative boxes on the chart. The target was hit again and again and again.
[07:17] And then it reached the limit of 10 transactions per day. In our per day. In our backtest, we had 2480 trades with an 85% success rate, a profit factor of 1.49, and an offset of 0.26.
[07:33] We had a 5% drawdown here. And that is the capital curve. These are the operations here. As you can see, these are great sequences of strategy here, right? These are several profitable operations in sequence, as you can
[07:46] see here. Time and time again, this strategy will achieve 100% accuracy at certain times, right? Until she hits a stop-loss order, her success rate drops, but she can still manage some excellent winning streaks. But you need to
[08:02] do your own tests there, right? I'm introducing you to backtesting here. You can do your own tests and come to your own conclusions, okay? Try it out in the simulator, always doing the tests so you can conduct your own
[08:16] studies and arrive at your own conclusions, okay? See you in the next video. Receive the channel's various strategies. There are dozens of open-source codes that you can use freely in your profit
[08:28] chart. Enroll today and receive, in addition to various setups, complete training teaching you step-by-step how to create strategies in the Profit Chart editor. And best of all, when you enroll, you get access to
[08:42] our support group, where we share various codes and create several strategies based on your feedback. Do you need to program a setup and don't know how? Through our support service, we
[08:55] create the code for you. Enroll today and get access to all of this right away . We share the setups with 100% open source code. You can request as many codes as you like throughout the two months of support. You
[09:11] will learn from scratch how to set up various trading systems and obtain statistics to discover winning strategies. A training program designed to teach traders to be more than just ordinary investors; they should
[09:23] develop new strategies for the stock market.
[09:38] [Music] [Applause] [Applause] [Music]


⚡ Saved you 0h 09m reading this? Transcribe any YouTube video for free — no signup needed.