
AI Summary
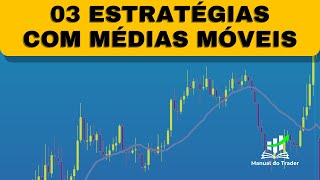
This video presents three trend-following strategies using moving averages, aimed at day traders. The hosts explain the basics of moving averages, demonstrate practical entry and exit techniques, and highlight common beginner mistakes.
Chapters
The video introduces three simple trend-following strategies using moving averages, with the third claimed to be unique and rarely seen.
A moving average is a line that smooths price data over a set period, acting as a guide to identify the overall trend direction.
Simple Moving Average (SMA) reacts slowly like a ship, while Exponential Moving Average (EMA) reacts faster like a speedboat. EMA is preferred for day trading due to quick market movements.
If price is above a rising moving average, it's an uptrend; if below a falling average, it's a downtrend. Avoid trading in sideways markets where the average is flat.
Use a 50-period EMA. Wait for the price to cross the average, then enter on the first pullback to the average. Place stop loss on the previous pullback and target 1:1 or 2:1 risk-reward.
Use the moving average to determine if the market is trending or sideways, then choose appropriate indicators or strategies accordingly.
Create a channel with two 50-period EMAs (one for highs, one for lows). Enter trades when price touches the channel, trading in the direction of the trend. Targets and stops are subjective, e.g., 200-point target with 100-point stop.
Avoid trading against the trend without confirmation, and don't enter at the exact touch of the average without waiting for price strength to avoid false breakouts.
The video provides practical moving average strategies for trend trading, emphasizing the importance of trend confirmation and avoiding sideways markets. The third strategy offers a unique channel-based approach that can yield significant gains.
Mentioned in this Video
Tutorial Checklist
Study Flashcards (10)
What is a moving average?
easy
Click to reveal answer
What is a moving average?
A line that follows the price on a chart, taking the average over a certain number of periods to smooth out fluctuations.
01:12
What is the difference between SMA and EMA?
medium
Click to reveal answer
What is the difference between SMA and EMA?
SMA averages prices equally and reacts slowly; EMA gives more weight to recent prices and reacts faster.
02:27
Which moving average is preferred for day trading and why?
medium
Click to reveal answer
Which moving average is preferred for day trading and why?
EMA, because the market moves quickly and you need fast responses to identify trends.
03:27
What is the key rule for identifying an uptrend using a moving average?
easy
Click to reveal answer
What is the key rule for identifying an uptrend using a moving average?
Price is above the average and the average is sloping upwards.
04:08
What should you avoid when the moving average is moving sideways?
medium
Click to reveal answer
What should you avoid when the moving average is moving sideways?
Trading, because there is no clear trend and a high chance of making a mistake.
04:37
In Strategy 1, when do you enter a trade?
medium
Click to reveal answer
In Strategy 1, when do you enter a trade?
On the first pullback to the 50-period EMA after a trend change.
06:01
What is the recommended stop loss placement in Strategy 1?
medium
Click to reveal answer
What is the recommended stop loss placement in Strategy 1?
On the previous pullback (low for buys, high for sells).
06:29
What is the purpose of Strategy 2?
easy
Click to reveal answer
What is the purpose of Strategy 2?
To use the moving average as a trend filter to decide which indicators or strategies to use.
08:59
How do you create the high-low channel in Strategy 3?
medium
Click to reveal answer
How do you create the high-low channel in Strategy 3?
Add two 50-period EMAs, one for highs and one for lows.
10:38
What is a common beginner mistake mentioned?
medium
Click to reveal answer
What is a common beginner mistake mentioned?
Trading against the trend or entering at the exact touch of the average without waiting for confirmation.
13:52
💡 Key Takeaways
Trend Identification Rule
Provides a clear, actionable rule for determining trend direction using moving averages, which is fundamental for all strategies.
04:08First Pullback Strategy
Offers a specific, repeatable entry method that capitalizes on trend continuation after a pullback.
05:17High-Low Channel Strategy
Introduces a novel approach using two moving averages to create a channel, potentially offering unique trading signals.
10:38Avoiding Sideways Markets
Emphasizes the importance of not trading in range-bound conditions, a common pitfall for beginners.
13:52Full Transcript
[00:02] points it gave, but it was more than 1000 points. Hey, trader, hey, everyone. It's time to open your manual. I am Lis. And I am Ricardo. And today we're going to show you three extremely simple, trend-following strategies
[00:16] using moving averages. You're going to really like it, especially the third you've never seen before, I don't think even on YouTube. Yes, but something you can't miss, in addition to our final tip in this video, is
[00:32] our playlist with other indicators, as well as our other videos here, so as well as our other videos here, so you can get the most out of our content. And to make the most of our content, you can help us
[00:45] by liking, commenting below, sharing, and also by clicking the notification bell to help our guide
[00:57] to help our guide continue to help you. Let's go to the video we already have a very interesting video about moving averages.
[01:12] What are mobile bad apples? It's simply a line that follows the price on the chart. She will take the price over a certain number of periods and calculate an average. That's why it's a moving average. Imagine that the price is like
[01:27] a winding road, with ups and downs, you know. And the moving average would act as a guide, taking the average and smoothing out those curves so you can and smoothing out those curves so you can understand the average and see the
[01:41] overall direction. And to help you better understand the trend using moving averages, basically, if the moving average is pointing upwards, we have an upward trend. If it's pointing downwards, we have a downward trend. It's
[01:56] simple, basically summarizing a bit more about the moving average, right? In trading, especially day trading, everything happens very quickly. If you only look at the candlesticks, you'll probably get confused. The moving average, then, will
[02:12] serve as a GPS for the trend, helping you understand better how to use it. And she will help you answer three basic questions. Is the price going up or down? Where can I find tickets?
[02:27] Where should I place my stop loss? All of this can be analyzed simply by using moving averages. Just passing by briefly, right? We have the SNA, the simple moving average, which averages prices equally, right? She
[02:43] will generally be slower, more sluggish, and react more slowly. And then we have the exponential rate, which gives more weight to recent prices, it reacts faster, it's more volatile, right? Think of it this way: the SMMA, or simple moving average,
[02:58] is like a ship. It will take her a while to turn, but she will point in a direction. The exponential moving average, or IMA, is like a speedboat. She will turn faster, indicating that direction more quickly and also having a faster reaction
[03:14] . Once you understand this, you 'll probably understand that moving averages will indicate this trend in various ways, right? For day trading, obviously, we'll use exponential moving averages because the market
[03:27] moves quickly, and you need quick responses and to identify trends rapidly. For those of you who prefer a longer-term analysis through prefer a longer-term analysis through swing trading or other methods, you
[03:41] can probably also use the SMA as an option, okay? Then you'll have a longer analysis and a longer reaction time for trend analysis, right? longer reaction time for trend analysis, right? You will notice that a price above this
[03:56] average indicates an upward trend, and, as already mentioned, a price below this average indicates a downward trend. But there is a very
[04:08] important rule for you to better understand moving averages. If the price is above the average and the average is sloping upwards, it has an upward trend. If the price is below the average and the average is sloping
[04:21] downwards, it indicates a downtrend, but many people make the mistake of analyzing the moving average and not noticing a sideways movement. And that's where many people go wrong. If he doesn't notice the lateralization, he'll want to operate. And
[04:37] in markets that are moving sideways , without a clear trend, you shouldn't trade. This is where many people go wrong. First, it's not enough for the price to cross the average; it needs to have a downward trend. And because of this, many people end up
[04:51] not noticing a sideways market. If the average is moving sideways there, if prices are moving sideways and you don't notice it, you run the risk of trading in a market that doesn't indicate a trend, a
[05:05] high chance of making a mistake. So, avoid operating in those situations. Beauty? Now let's move on to the practical part. So let's look at the three strategies. To begin, the first strategy, then, calls for the first
[05:17] strategy, then, calls for the first pullback. So, let's look at the graph. pullback. So, let's look at the graph. Let's insert the moving average then. Using a moving average, we'll use a 50-period moving average,
[05:32] and it will be exponential, okay? So, exponential 50. And to make it a little easier to visualize, I made it a little thicker. That's all we're going to use. So, what is the idea behind this operation,
[05:47] this first strategy? We'll look for the point when the price crosses the moving average; for example, it was in a downtrend and then crosses into an uptrend. We don't do anything when we cross paths. However, when it
[06:01] makes its first pullback to the average, when it touches this average, it activates our signal for us to make the buy order. In this case, the average buyer buys because it's in an upward trend. So it came, right, crossed over from the bottom
[06:14] to the top, and turned into an upward trend. First pullback here in the average. So First pullback here in the average. So we'll make our entrance right here. It touched the average, enter the next candle. Our stop loss is usually placed on the
[06:29] previous pullback. So this would be the pullback here. Generally, we use this strategy one-for-one or two-for-one. So we're going to take the risk-gain approach here, and we'd place
[06:43] our stop-loss down here, right? So our gain would be up here on this green line. Let me even delete these two here. If you want to do two for one, that's also possible. Two for one, right? So here it
[06:57] possible. Two for one, right? So here it would be a gain of 200 points, 190. So it would be a gain of 200 points, 190. So it would be more or less 380 points and it would have already hit the target. Actually, it even reached over 500 points, right? And it worked the next time
[07:09] too, but our strategy doesn't work on the second pullback. Our strategy is really focused on the first pullback. I'll give you an example of a sale here. And on this day, we can explain very well how the
[07:23] sales operation works. It's the same system. It was high, right, above the 50-period moving average. It broke through, went down, turned around, you know, the market went into a downtrend. First touch, then, on average,
[07:37] put it here. If it hits the average frequency here, we'll get in. get in. Our stop will be up there. Should I advise placing the stop loss up there? No. Why? Because the stop loss is too long
[07:50] . Let's see how many points this would give us . 800 point stop loss. Almost 900. Yes, it 's unfeasible. So this trade could smaller stop loss, because since we entered here, we would
[08:03] n't know what the peak of this pullback would be. But you could start with a two-for-one bet of 300 points, for example. Let's see what 300 example. Let's see what 300 points would be here. Wow, right here.
[08:17] So we would stop, one for one here, right, and 300 points, and we would have already unintentionally, incredibly enough, here I managed to get 300 points, we managed to make a profit of
[08:32] we managed to make a profit of exactly 300 points here, 285, in case you didn't get it here, you certainly got it a little later on. Yes, ideally you should tighten the stop loss gradually, because if the market turns around, you're already more
[08:44] protected, either with a smaller stop loss, or if you want, you can tighten it even more over the break-even point because all protection is welcome. This is how this first strategy works. Now let's move on to the second strategy.
[08:59] The second strategy is more of a tip than a strategy in itself, because what happens is...? Many people use moving averages in their trading, whether it's a pullback strategy, a mean reversion strategy, or any other strategy
[09:12] utilizing moving averages. But what its real function is to indicate whether something is trending or not. So this second strategy is simply about looking at the moving average and understanding what it's telling you, so you can then
[09:27] trade. For example, it is quite clear here that the moving average is moving sideways. Extremely clear here. Here, she's turned to the side right now, not completely to the side, but just a little bit. So
[09:42] what kind of strategy am I going to use? You're going to pick a set of indicators that are useful when the market is sideways. Wow, look how tilted it is! So you will, of course, trade in favor of the trend.
[09:57] So you know that you're going to be making buy operations here that are extremely skewed downwards. So you know that your operation is a sales operation. So use the moving average as a signal to help you understand. Oh man,
[10:11] I want to use those sets of indicators. Ah, this operation here is sideways. I will use other types of indicators to trade when the market is sideways or not.
[10:23] moving sideways, it's much harder to get it right then. So, you use the moving average to identify the trend and know what type of operation, indicators, or strategies you will use. Now we're going to move on to the
[10:38] third strategy, which I'm sure you've never seen before. So now, to begin this third strategy, we also use the moving average. So, we click here, enter the 50-period moving average, and click OK. Beauty.
[10:54] But there are two moving averages, so we'll add it twice. Let's go. Moving average. Enter 50.
[11:08] let's edit the first one, remembering that it's exponential, and set the appearance to a thickness of three. However, the difference is that we're going to create a high-low channel. So let's use the first one as the maximum. OK?
[11:24] Let's take the second exponential moving average . I'll leave the reddish color to make it look better better and less noticeable. So, we have a
[11:36] maximum average and a minimum average. With this, we create a media channel. And what happens with this channel? The price seems to tend to move as if by magnetism. He tends to go to that channel. When it enters the channel, it activates
[11:50] the sensor, activating our signal. And then we think about an operation that goes against the trend. So, let's look here a little closer, zoom in a little better here. Now yes. So, what do we do then? So, the price is in a
[12:06] downtrend, clearly in a downtrend, and we make a downtrend, and we make a trade when it enters this channel, ideally when it touches the average of the high, OK? And we execute a sell operation, which
[12:20] is in favor of the trend. The question of where to place the stop loss or what our target is, that's very subjective. The interesting thing for us here is to show you the strategy and for you to test which one is ideal. So, if you want to test it out,
[12:33] I think a target of 200 points for a 200-point stop is good, or a 100-point stop with a 200-point target to do a two-for-one or three-for-one. Well, in this case, this strategy worked really well, and it usually does
[12:48] work really well. If we look a little further ahead, the price tends to return to this region of the averages and continue the downward movement . Here it shifted slightly to the side, but it continued its downward movement even further
[13:01] . And when it crosses, right? Here, the strategy worked again, and going to work, right? There will definitely be a stop loss, right? And he also showed
[13:13] respect on the other side. If you made a buy order here, depending on where you placed the stop loss, it worked very well. I don't know how many points I got here , but more than 1000 points. So it's a really cool, very
[13:27] interesting strategy. Sometimes it works, sometimes it doesn't, like all strategies. And I'm sure you've never seen anything like it . If you liked these three strategies or would like to see more
[13:39] , please comment below and we'll bring you those other strategies or indicators. Hey, just leave a comment, ask us, and we'll make a really cool video for you, OK? Now that you've seen all the
[13:52] practical aspects, let's talk about the mistakes that beginners usually make, shall we? First, trade against the trend, because it looks like it's going to turn around. Well, you have ways to trade against the trend, but you have to do it very
[14:08] cautiously, right? It's about entering at the exact touch of the average without waiting for confirmation. You might fall for false breakouts or false trend indications, place
[14:21] a stop loss right there, and be stopped out by the noise of the price movement itself. Well, using that example we talked about at the beginning of the video, imagine you arriving
[14:33] and making a very quick maneuver with your boat and ending up capsizing it, let's say, right? Always wait for the price to show strength before entering and accelerating, and then actually trading, okay? That's it , we've reached the end of another video.
[14:49] I hope you enjoyed it very much and that you understood it. If you didn't understand, go to our Instagram and send us a message in the inbox. We'll explain it, whether by video, voice message, text message, however you need to
[15:02] understand. Yes, and that's it. For those of you who watched this video and thought, "Wow, they went through moving averages really quickly there, here's a basic explanation." We have a video here, an entire playlist about
[15:15] indicators, and a video explaining moving averages in more detail and how to use them to accurately predict trends. We have other videos teaching you how to trade using the trend, how to trade with the trend, and videos teaching you how to trade against the
[15:31] trend. So don't forget to like, comment, and subscribe to our channel, okay? So that's it, until next time and bye bye.