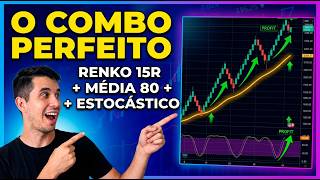

Stop Trading Time! The Secret of Renko 15R + 80 MA on Mini Index
45sThe title and opening directly challenge common trading frustrations, hooking viewers with a promise of a game-changing strategy.
▶ Play Clip"Title promises a secret to stop trading time, and the video delivers a concrete strategy using EMA and stochastic."
This video presents a trading strategy for the Brazilian Mini Index (Mini Índice) that combines an 80-period exponential moving average (EMA) with a slow stochastic oscillator. The presenters, Lis and Ricardo, explain how to use the EMA as a long-term trend filter and the stochastic to identify overbought/oversold conditions, aiming to capture profitable trades with a 1:2 risk-reward ratio.
Lis and Ricardo introduce the 'sniper combo' strategy using the 80-period exponential moving average and the slow stochastic oscillator.
The 80-period EMA acts as a long-term trend compass. Only consider buying when price is above the EMA, and only selling when price is below it.
The slow stochastic oscillator indicates overbought (above 80) and oversold (below 20) conditions, signaling when the market needs to pause.
Buy when price is above the EMA and stochastic crosses above 20 from below. Sell when price is below the EMA and stochastic crosses below 80 from above.
Stop loss is set at a recent swing low/high (e.g., two Renko bricks), and take profit is twice the stop loss distance (e.g., four bricks).
A buy signal resulted in a stop loss, demonstrating that losses are part of the process.
A sell signal below the EMA with stochastic overbought led to a profitable trade, achieving the 1:2 risk-reward target.
On a 15R Renko chart, each brick equals 70 points. With 2 wins and 1 loss, net gain was 420 points. Emphasizes patience and risk management.
Keep a trading journal to log entries, exits, and outcomes. Analyze data to identify patterns (e.g., avoid trading on Fridays).
The sniper combo strategy combines a trend filter (80 EMA) with a momentum oscillator (stochastic) to generate high-probability trades with a fixed risk-reward ratio. Consistent profitability requires discipline, risk management, and thorough journaling.
What is the primary trend filter used in the sniper combo strategy?
The 80-period exponential moving average (EMA).
00:43
What are the overbought and oversold levels for the slow stochastic oscillator?
Overbought above 80, oversold below 20.
01:13
What is the entry condition for a buy trade?
Price above the 80 EMA and stochastic crosses above 20 from below.
02:49
What is the entry condition for a sell trade?
Price below the 80 EMA and stochastic crosses below 80 from above.
03:04
What is the recommended risk-reward ratio for this strategy?
1:2 (stop loss is half of take profit).
04:01
How many points did the presenter gain in the example day?
420 points (6 bricks × 70 points per brick).
06:11
Why is keeping a trading journal important according to the video?
To analyze trades and identify patterns, such as avoiding trading on Fridays.
06:57
EMA as Market Compass
Establishes a clear trend filter that simplifies decision-making.
00:43Stochastic as Breath Gauge
Provides a concrete method to gauge market exhaustion.
01:13Fixed Risk-Reward Ratio
Demonstrates a disciplined approach to profit-taking and stop-loss placement.
04:01Trading Journal for Data Analysis
Highlights the importance of tracking trades to improve performance.
06:57[00:02] open your manual. I am Lis. And I am Ricardo. And today we're going to talk And I am Ricardo. And today we're going to talk about the sniper combo. It is the exponential moving average and the slow stochastic oscillator. AND . E se você não quer continuar sendo o
[00:16] . E se você não quer continuar sendo o escravo do relógio e realmente ler o movimento que está ocorrendo à sua frente, primeiramente dá um like, se inscreve no nosso canal, comenta aqui se você já ouviu falar dessa estratégia e
[00:30] você já ouviu falar dessa estratégia e vamos para o vídeo. Play the intro. 80-period exponential moving average. It will be our compass for the market in the long term.
[00:43] An average of 80 is the grandma of the market. She is slow, she is wise, and she doesn't get flustered market fluctuation. A média móvel de 80, ela será a nossa tendência macro e com isso a gente só vai pensar em compra se o preço estiver
[00:59] acima dela e só vai pensar em venda se o preço estiver abaixo dela. And our second item, the slow stochastic oscillator. A classic that everyone has, but nobody classic that everyone has, but nobody really knows how to use without getting frustrated.
[01:13] The stochastic oscillator is our breath gauge. He says when the market has gone too far and needs to stop for breath. And that's where our strategy comes in, right? So when the stochastic oscillator is above 80, it indicates an overbought condition. And when
[01:26] it's below 20, it indicates overselling. With on-screen graphic. So let's overselling. With on-screen graphic. So let's add our 80-period moving average. And while we're at it, let's also
[01:42] also add our slow stochastic oscillator down here. Beauty? Stochastic. So, how is it configured? how is it configured? Stochastic, OK? Okay, the moving average,
[01:55] let's set it to exponential. And as for the appearance here, let's leave it as is, it can stay green, it doesn't matter. I'll make it a little thicker to make it easier to see.
[02:08] In the stochastic oscillator, we'll always look at the 80 and 20 indices down here on the right. So, to make it easier, right-click, price scale properties , we come here, see, in fixed grid, horizontal grid. I'm going to remove the
[02:23] 50 one, there's no need to leave only the 20 and 80. What will happen? They're going to create two lines, which is precisely what we need to keep an eye on. So how will the operation proceed?
[02:35] The operation will be carried out as follows . If the price is below the moving average, we only think about selling. If the price is above the moving average, buy. That's fine. With stochastic oscillators, what are we going to see? If the price
[02:49] is below the 20 line here and it goes up over 20, it's not when it breaks up. Then we think about a purchase operation. If it's above 80 and breaks
[03:04] downwards, we'll consider a sell operation. So, when we combine these two filters, we perform our operation. So, let's show an example here. It's below here, should we consider buying it? No,
[03:17] because here we only think about sales. Let's go. Here, for now, the only thing thinking is buying, but the stochastic oscillator is showing a sell signal. We do nothing. We do nothing. here. However, we cannot consider buying based solely on the
[03:30] average price. Let's look a little further ahead. Selling doesn't help at all. ahead. Selling doesn't help at all. Okay, here we've found our spot. Around here, all we think about is shopping. And look , our stochastic oscillator is
[03:42] oversold, so they might be oversold too. So when it breaks out from below upwards, the 20 line is our buy signal. our buy signal will be. It's going to be in this candle here, right? Then it broke. Boom,
[04:01] candle here, right? Then it broke. Boom, he bought it. Let's put it here that it was in this position here. He bought. Where is our stop? It's simple, it's fundamentally based on that. And where our profit is, it's twice our stop loss. So, if our stop is
[04:15] down here, which would be two bricks, then our game is four bricks. And look, it came out looking cute. We bought our tickets here, played our game here, and easily won our points. How many points? Approximately 250 points. So let's go, all we
[04:30] think about is shopping, shopping, shopping, shopping. Hey, I wonder if something happened here? Nothing happened. So come back, come back. Let's go. Now we're going to begin. Hey, here! Here's a little shopping trip. Let's go. Where did
[04:44] the purchase take place? This is where our stochastic oscillator broke down. This is our entrance. Did it work? Let's look at our entrance here. Let's do a two-for-one here. Then, our stop signal came in down here. Our game is
[05:01] up here. Unfortunately, it didn't work. This was a stop. Even if I put a candlestick here to see the line, the chart is still, right? Of course. Well, it didn't work . We were stopped. It's part of the process. It 's not always possible to win,
[05:14] right? Let's look a little further down here. There's nothing that can be done about the purchase operation either . Here came a sales transaction. Look, it's below our moving average. And the stochastic oscillator here indicates that it is
[05:27] overcompressed. Our entrance here. Let's go. Stop loss. Two bricks above. Stop gain
[05:40] four points below. Perfect. Another gain. So we had one loss and two gains. Let's see if there were any more operations that day . Not for the time being . Sell operation here, buy operation here, sell here and buy
[05:56] here. In other words, this day was a profitable day because we had two gains, but our gains were two to one. So we won, let's say, eight bricks, but we lost two bricks, meaning we had six bricks left in the
[06:11] game. Since we're on the 15R, I'll show you here. 15R equals 70 points. you here. 15R equals 70 points. So we had 6 x 7, 42. So, we had 420 game points that day. And remember, it's very important to keep this
[06:27] in mind as a final point we're making here, that in this case we will be, whether we like it or not, operating against the trend. What does this require? a lot of patience and, obviously, risk management. We have a
[06:41] video about risk management, and it's very important that you always watch our videos where we talk about risk management, because it's essential. Another very important item, not only for this type of
[06:57] strategy but for any strategy, is that you have to keep a trading journal. You have to write down what time you logged in, why you logged in, whether it was good, or whether it was bad. Try to analyze all your trades, then you can take all
[07:11] those notes, whether in a notebook, Excel, or wherever you want to write them down, and use artificial intelligence or do this type of analysis yourself to discover: "Wow, at such and such time I only had bad trades, but at these
[07:25] times I have many more wins, or Friday isn't a very good day Fridays. Don't trade on Fridays [laughs] or change your Friday strategy to something else." All this data analysis is extremely
[07:40] important and you need to do it, especially if you're studying, and if you . So imagine for someone who is just studying. It's a very important thing you should do as soon as you notice your
[07:53] trades, and also note that you should subscribe to our channel, give a like, comment below if you already knew this strategy, or suggest a strategy or indicator you'd like to
[08:06] know more about. And with that, don't forget to watch this video here, which will certainly help you a lot in your trades. Until next time. Three good ones.



⚡ Saved you 0h 08m reading this? Transcribe any YouTube video for free — no signup needed.