
AI Summary
This video presents an advanced tutorial on Smart Money Concepts (SMC) for trading, outlining three distinct strategies designed for high-probability entries. The core principles involve identifying liquidity zones, waiting for liquidity grabs or sweeps, and using lower time frames for precise entries. The presenter provides step-by-step chart examples to illustrate how to apply these strategies in live market conditions.
Chapters
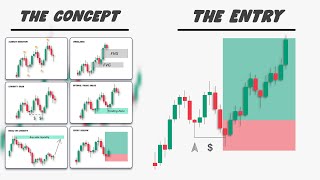
The strategy is built on three main concepts: a draw on liquidity, a liquidity grab, and the entry. It uses two time frames, with the entry timeframe being two levels lower than the higher timeframe.
A draw on liquidity is a level price is moving toward, often where stop losses and pending orders are clustered, such as equal highs, equal lows, or sharp reversal points.
A bullish liquidity grab occurs when price breaks below a previous low but quickly returns inside the range, signaling bullish momentum. A bearish grab is the opposite.
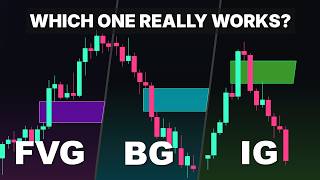
The second strategy uses the 1-hour chart for trend analysis and marking fair value gaps (FVGs), then switches to the 5-minute chart to find a liquidity grab as an entry trigger.
The third strategy combines buy-side and sell-side liquidity with liquidity sweeps and FVGs. It explains how smart money targets these zones to fill large orders.
The video emphasizes proper risk management, advising traders to never risk more than 2-3% of their account per trade and to wait for high-quality setups.
Mentioned in this Video
Tutorial Checklist
Study Flashcards (7)
What is a 'draw on liquidity'?
easy
Click to reveal answer
What is a 'draw on liquidity'?
A liquidity level that price is moving toward, often where stop losses and pending orders are clustered.
01:52
What is a bullish liquidity grab?
medium
Click to reveal answer
What is a bullish liquidity grab?
When price breaks below a previous low but quickly returns back inside the range, indicating sellers failed to push price lower.
03:39
What is the rule for time frame selection in these strategies?
easy
Click to reveal answer
What is the rule for time frame selection in these strategies?
Your entry time frame must be two time frames lower than your higher time frame.
01:23
What is a fair value gap (FVG)?
medium
Click to reveal answer
What is a fair value gap (FVG)?
A fair value gap is an area on the price chart where there is a gap between the fair value of price, which the market often returns to fill.
06:29
What is the recommended risk per trade?
easy
Click to reveal answer
What is the recommended risk per trade?
Never risk more than 2 to 3% of your account per trade.
08:16
Why does smart money push price to grab sell-side liquidity?
hard
Click to reveal answer
Why does smart money push price to grab sell-side liquidity?
Smart money pushes price to grab liquidity to fill their large orders, as breaking below a level triggers stop losses and breakout sellers, providing enough selling pressure.
09:12
What is the difference between buy-side and sell-side liquidity?
medium
Click to reveal answer
What is the difference between buy-side and sell-side liquidity?
Liquidity above a high or a group of highs represents buy-side liquidity, and liquidity below a low or a group of lows represents sell-side liquidity.
08:29
💡 Key Takeaways
The Draw on Liquidity
This is the foundational concept for all three strategies, explaining why price moves to certain levels.
01:52Bullish Liquidity Grab
Provides a clear, actionable entry signal that is used across multiple strategies.
03:39Why Smart Money Targets Liquidity
Explains the underlying logic of why price reverses after sweeping liquidity, which is key to understanding market manipulation.
09:12Risk Management Rule
A critical reminder that success in trading depends on capital preservation, not just entry signals.
08:16Full Transcript
[00:01] cover an advanced tutorial on smart money concepts and some of the best trade entries for 2026. Today, we'll explain [music] the fundamental trading concepts including market direction, imbalances, draw on
[00:14] liquidity, liquidity grabs, optimal trade areas, entry confirmations, and [music] through three high probability SMC in detail. >> [music]
[00:27] chart examples to show you how [music] to apply these strategies effectively in live market conditions. If that sounds [music] interesting, make sure to hit the like button to show your support and subscribe to the channel if
[00:40] you're new. >> Hey!
[00:52] This strategy is made up of three main concepts: a draw on liquidity, liquidity grab, and entry. In this setup, we use two time frames to On the higher time frame, we mark the
[01:07] liquidity. Then, we zoom into the lower time frame. On the lower time frame, we want to find a liquidity grab in the direction of the Then, we simply open the trade and set our target and stop loss.
[01:23] Before we get onto the charts, remember, this trading plan is not limited to any specific time frame. However, your entry time frame must be two time frames lower than your higher time frame. Here are three time frame combinations
[01:36] you can use based on your trading style. For example, if your higher time frame is the 4-hour chart, you should zoom into the 15-minute chart to place the Now, let me show you how it works on the price chart.
[01:52] liquidity on the higher time frame. But, what is a draw on liquidity? liquidity level that price is moving toward. In simple terms, the market often moves to areas with resting liquidity, such as
[02:06] equal highs, equal lows, or sharp reversal points, because that's where many stop losses and pending orders are waiting to be triggered. You can mark these levels manually. The first step is to look for a key high or
[02:18] low on the 1-hour chart that price is moving toward. So, let's enable the key liquidity levels in the indicator settings by turning on equal highs and liquidity. As you can see in this example, we have
[02:31] buy-side liquidity on the 1-hour chart, and the price is drawing up toward it. We can anticipate the price reaching for this high, since that's where liquidity If you can't find a clear draw on liquidity on your selected time frame,
[02:45] you can analyze other time frames to find a clearer formation. The next step is to zoom into a lower time frame and identifying a liquidity grab in the direction of our draw on liquidity. So, let's switch to the lower
[02:58] time frame. Keep in mind that the buy-side liquidity Now, we're looking for a swing low to be taken out. In other words, we want to find a bullish liquidity grab, which signals potential upward continuation. A
[03:12] bearish liquidity grab occurs when price breaks above a previous high, but quickly moves back inside the range. This shows that buyers failed to create a new high, and price is immediately pushed back into the range, indicating
[03:26] bearish momentum. And after such a move, we often expect a stronger move to the downside. Similarly, a bullish liquidity grab occurs when price breaks below a previous low, but quickly returns back
[03:39] This indicates that sellers failed to push price lower, and the market immediately rejects the lower prices, signaling bullish momentum. After identifying a bullish liquidity grab, we can enter the trade right after
[03:53] the price returns inside the range. Alternatively, a more conservative continue pushing upward to confirm the reversal, formations to set a buy limit. If you can't find any FVG's on the
[04:08] 5-minute chart, you can zoom into the 1-minute chart for more precision. bearish setup. important liquidity area that the price is moving toward.
[04:22] This could be a previous low or a level where many stop losses are sitting. before it reverses. After that, switch to the 5-minute Wait for the price to move above a recent swing high and then quickly come
[04:37] This shows that the market has grabbed the liquidity and may start moving lower. Next, open a short trade and place your liquidity grab. Give the price some space to move, and
[04:50] don't keep your stop loss too tight. For your target, liquidity. This way, you trade with a clear plan. Now, let's continue with the second trading setup.
[05:05] In this setup, we use two time frames to enter the trade. The 1-hour chart as our higher time frame and the 5-minute chart as our lower time frame. On the 1-hour chart, we analyze the market structure to find the trend.
[05:17] Look for breaks of structure and changes in character to find the direction. Then we mark the fair value gaps, which serve as our optimal trading zones. Then, we wait for the price to pull back inside the FVG area and then switch to
[05:31] the lower time frame. On the 5-minute chart, all we need is an entry reason to set up the trade. A liquidity grab formation inside the higher time frame FVG. Once we see that, we enter the trade and
[05:44] This strategy works because it combines three important concepts. It helps us optimal trading zones, and use lower time frame charts for extra Now, let me show you how it works on the price chart.
[06:01] market direction by marking breakouts and reversal signals. We're going to use the price action toolkit indicator to identify the trend. So, let's go to the settings tab and enable BOS, chalk, and chalk plus in the market structure
[06:15] section. Here, we can see that the price is breaking structures to the upside on the 1-hour chart. So, we are witnessing an uptrend and only looking for buying opportunities. Next stop, we have fair value gaps.
[06:29] the price chart where there's a gap between the fair value of price. The market often returns to fill these gaps as price seeks balance. We'll use these gaps as key areas of interest expecting possible price
[06:43] First, we wait for the price to return inside the gap, signals on the lower time frames to enter a buy trade. enter a buy trade. So, let's switch to the 5-minute chart.
[06:56] time frame, you want to look for signs of a possible reversal. One strong signal is formation of a bullish liquidity grab pattern. push price lower, signaling bullish momentum.
[07:11] If the following move also forms a change of character, it provides us additional confirmation. Now, let's open the trade. low of the liquidity grab, and your target can be the next important level
[07:24] on the higher time frame. Similarly, in a bearish setup, start on trend. In this case, the market is making lower lows and lower highs. So, it's in a downtrend, and we are only
[07:39] interested in selling opportunities. Now, let's mark the fair value gaps as potential supply zones. When the price pulls back into one of those gaps, switch to the lower time frame,
[07:52] and look for a bearish liquidity grab above a recent high. Enter the trade after confirmation. Place your stop loss above the liquidity grab, and aim for the next key level below.
[08:04] With all that said, make sure to use proper risk management to protect your capital. Stick to your plan, and avoid emotional decisions. Wait for high-quality trades to form, and never risk more than 2 to 3% of your
[08:16] account per trade. Now, let's continue with the final trading strategy. The third trading strategy also uses two time frames, and combines the concepts of buy-side and sell-side liquidity,
[08:29] liquidity sweep, and fair value gaps as an entry point. liquidity? Liquidity above a high or a group of highs represents buy-side liquidity, and liquidity below a low or a group of lows
[08:44] represents sell-side liquidity. Now, what happens around these levels? Institutional traders or smart money often target these liquidity zones. For example, if smart money wants to buy an asset, they need a lot of sellers in the
[08:57] market to fill their large buy orders. So, where are the sellers in the market? We know that if the price taps into a key support level, many retail traders or even institutions will go long. They will place their stop losses, which
[09:12] are basically sell orders, somewhere below that area. Smart money will push the price lower to grab that sell-side liquidity, and activate those stop losses. This gives them enough selling pressure
[09:24] to fill their large buy orders. Also, breaking below this level will cause some sellers to jump into the market, thinking the price is about to drop further. But in many cases, after smart money
[09:36] grabs the liquidity, the price quickly reverses and moves higher. This traps both early buyers and breakout sellers. The same logic works in reverse for buy-side liquidity. If smart money wants
[09:50] to sell, they need buyers. So, they push the price up above a key Trigger buy stop orders and breakout entries. And then reverse the price downward after collecting enough liquidity.
[10:03] With all that being said, some liquidity levels are more important than others. Certain criteria can help you spot the stronger ones. For example, liquidity around major swing highs and lows, higher time frame
[10:16] highs or lows tend to be more significant. Now, let me show you how the third trading strategy works on the chart. First, mark the buy-side and sell-side liquidity zones on the chart. Then, wait
[10:31] for the price to break out beyond one of these zones, and then quickly close back inside the range. This shows a liquidity sweep or false breakout, where smart money has collected the orders and is likely
[10:43] opposite direction. Then, zoom into the lower time frame and look for fair value gaps that formed right after the sweep. These gaps show imbalance and can act as entry zones.
[10:57] If it's a bearish scenario, for example, after a sweep above a buy-side liquidity level, look for a gap and signs of a reversal. Once confirmed, you can open a short trade. Place your stop loss above the
[11:09] high of the sweep and target the next key level or sell-side liquidity below. scenario. We focus on the sell-side liquidity below key lows. When the price sweeps this level and
[11:24] closes back inside the range, it signals a bullish liquidity grab. Then, we zoom into the lower time frame and wait for the indicator to highlight a bullish fair value gap that forms right after the sweep. This gap is used
[11:38] as the entry zone. Enter a long trade from the gap. Place your stop loss below the swing low and target the next buy side liquidity level. This simple process helps you trade with smart money, not against it. Remember, more
[11:52] trades does not mean more profit. Waiting for high probability setups to appear and filtering out low quality ones is a skill that takes time and With all being said, if you'd like to use the price action toolkit with 15%
[12:06] off, make sure to check the link in the description. Thanks for watching and see description. Thanks for watching and see you in the next one.