
AI Summary
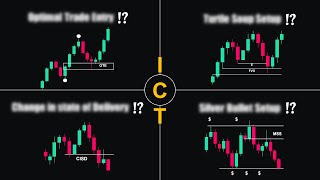
This video breaks down four effective ICT (Inner Circle Trader) trading strategies, explaining their psychology, how to identify them on charts, and how to trade them. The strategies covered are the Silver Bullet, Turtle Soup, Change in State of Delivery (CISD), and Optimal Trade Entry (OTE).
Chapters
The video introduces four ICT trading strategies that are simple and effective, based on backtesting and live trading.
Combines liquidity, market structure shift, and fair value gap entry. In a bearish scenario, price breaks above day's high to take liquidity, then a bearish market structure shift signals reversal, and entry is at a fair value gap.
On a 5-minute chart, mark the day's high and low before New York session. Wait for liquidity sweep beyond these levels, then a market structure break, then enter at a fair value gap with targets at resistance levels.
Occurs when price sweeps liquidity below a recent low (bullish) or above a recent high (bearish) while resting above/below a fair value gap. It takes advantage of false breakouts to continue the trend.
A reversal pattern where momentum shifts suddenly. It signals a fakeout and a potential reversal. Key difference from change of character: CISD focuses on momentum shift and can signal earlier.
Rule 1: Rejecting a higher timeframe key level. Rule 2: Sweeping a liquidity pool. Rule 3: Volume and confirmation via fair value gaps.
Uses Fibonacci retracement levels (61.8% and 78.6%) to identify the optimal zone for entries. Combining OTE with fair value gaps increases the probability of success.
The video provides a comprehensive overview of four ICT strategies, emphasizing the importance of liquidity, market structure, and fair value gaps. It offers practical steps for each strategy, making them accessible for traders looking to improve their technical analysis.
Mentioned in this Video
Tutorial Checklist
💡 Key Takeaways
Smart Money Psychology
Explains the institutional reasoning behind price movements, crucial for understanding ICT concepts.
01:49Liquidity Pools
Clarifies where liquidity exists and how it fuels price movements, a core principle in ICT.
05:30CISD Rules
Provides actionable rules to filter high-probability CISD setups, improving trade reliability.
11:17Optimal Trade Zone
Defines the specific Fibonacci levels that form the OTE, a key concept for precise entries.
15:37Full Transcript
[00:00] There are plenty of ICT trading strategies out there, but the problem is that most are overly complicated and hard to apply in real trading. After extensive back testing and live trading, we've identified a few strategies that
[00:14] work exceptionally well and are simple to use. In this video, we'll break down four of the most effective ICT trading strategies. You'll learn what they are, the psychology behind them, how to spot them on the chart, and the right way to
[00:29] to trade them for the best results. So guys, if that sounds interesting to you, don't forget to hit the like button to show your support. And if you're new here, make sure to subscribe for more valuable content.
[00:41] See you after the intro and disclaimer. Number one is the silver bullet trading strategy.
[01:01] The silver bullet trading strategy is one of the best smart money setups, combining the concepts of liquidity, market structure shift, and fair value gap entry. In the bearish scenario, the price first breaks above the day's high and takes out the liquidity.
[01:17] This shows that the market is targeting liquidity above the most important structure of the day, which is the highest price traded during the Asian or London sessions. Next, we wait for a bearish market structure shift, which signals a possible reversal to the downside.
[01:33] This confirms that the bullish move is ending and sellers are taking control. At this point, we look for a fair value gap as the best area to enter a short trade. The psychology behind this strategy is based on how smart money operates.
[01:49] When institutional players want to sell, they first need to attract buyers. To do this, they push the price above the day's high, triggering stop losses and inducing breakout traders to go long. Once enough liquidity has been collected, smart money shifts direction, driving the price downward to target the sell-side liquidity below the day's low.
[02:11] The same concept applies in a bullish scenario. First, we look for the price to break below the day's low, taking out liquidity. Then, we wait for a market structure shift to the upside, signaling a potential reversal.
[02:25] Once this happens, we identify the best areas to enter a long trade, which are the fair value gaps. To trade the silver bullet, open any chart on TradingView and set the time frame to 5 minutes.
[02:40] Right-click anywhere on the chart and select Settings. From the Events tab, select Session Breaks. Vertical lines dividing each day will now appear on the chart. Here we have the Eurodollar on the 5-minute chart.
[02:54] The first step is to mark the high and low of the day before the New York session opens. Here at the top, we have the highest price traded during the Asian session, and at the bottom, here we have the lowest price traded so far today.
[03:08] As the New York session begins, the price wicks below the day's low, but quickly moves back inside the range. This looks like a liquidity grab. However, to confirm a true reversal, we need to see a market structure shift,
[03:21] where the price breaks above a recent supply level. Following this chart, we see the price drop even lower, but quickly moves back inside the range. But this time, it breaks above the recent supply area, confirming the reversal.
[03:35] So, where is the high probability entry? The latest move has created a fair value gap, which will act as a demand zone if the price returns to it. So, we'll set a buy limit at the start of this zone and place our stop loss below the swing low.
[03:52] For profit targets, we'll aim for key resistance levels ahead of the price. Now let's go over the silver bullet strategy step-by-step one more time. First, mark the days high and low before the New York session opens.
[04:07] Next, wait for the price to sweep liquidity beyond these levels and return inside the range. Then look for a market structure break below a key demand level to confirm the reversal After that identify a fair value gap and set your entry within this zone and set your
[04:24] targets at important resistance levels. Now let's move on to the next topic, the Turtle Soup Setup.
[04:36] Turtle Soup Trading Setup is another powerful model that combines the concept of market direction, liquidity with a fair value gap entry. A high-probability bullish turtle soup setup occurs when the price sweeps liquidity below
[04:50] a recent low or a group of lows while resting above a bullish fair value gap. Similarly, a bearish turtle soup occurs when the price sweeps liquidity above a recent
[05:02] high or a group of highs while resting below a bearish fair value gap. The psychology behind this setup is simple. Imagine the market is in a clear uptrend.
[05:15] If smart money wants to buy this asset, they need sellers in the market. In other words, they need liquidity. But where does liquidity exist? Liquidity is found below every swing low and above every swing high.
[05:30] The traders who entered long at these levels have their stop losses placed below the swing lows. Each time price returns to these areas, new orders accumulate and therefore stop losses. If the price collects enough liquidity, it will have the momentum to move higher.
[05:45] Otherwise, it will continue dropping, creating even more liquidity zones. By sweeping sell-side liquidity, price gains enough fuel to resume its upward movement.
[05:57] This is what makes the turtle soup strategy so effective. it takes advantage of liquidity pools to identify high probability continuations. Things get even more interesting when a fair value gap exists just below this liquidity pool.
[06:11] This creates a high probability trade opportunity in this area. Since liquidity is resting below the support level, there is a strong chance that price will break below the support, sweep liquidity,
[06:23] and then reject the fair value gap to the upside. Once this rejection occurs, price is likely to gain bullish momentum, push higher, and continue the uptrend. This setup provides a smart way to trade with the trend while using liquidity and fair value gaps to identify precise entry points.
[06:42] Here on the pound-yen 5-minute chart, we see a clear uptrend. Normally, breaking below the recent low signals, a market structure shifts to the downside. However, if you check the left-hand side, you'll notice an FVG area just below the swing low.
[06:59] This increases the likelihood of price tapping into the liquidity below the recent low before continuing upward from the fair value gap. Once again, notice how price builds a liquidity pool right above the FVG.
[07:14] The conditions are set for price to engage sell-side liquidity, reject the FVG, and push higher. Of course, this doesn't work every time. However, the turtle suit strategy can take advantage of false breakouts
[07:28] and profit from price reversing back in the trend. Next, we have the powerful concept of change in state of delivery, or CISD. But before we continue,
[07:42] if you're looking for a reliable trading platform with unique services, check out Markets.com. They are one of the top-rated brokers on Trustpilot, offering a diverse selection of trading assets, including Forex, stocks, crypto, and more.
[07:57] Markets.com is known for its user-friendly interface and excellent customer service, available in multiple languages to assist you. Markets.com is a trusted, regulated broker with 17 years of experience and nearly 5 million users.
[08:11] As a welcome offer, new clients can get a bonus of up to $2,000 on their first deposit. If that sounds good to you, check the link in the description to get started. So, what exactly is the change in the state of delivery?
[08:24] CISD is a reversal pattern in which the price's momentum shifts direction suddenly signaling a potential reversal In this example you can observe a clear bullish trend The latest price action shows a significant bullish momentum where buyers have broken
[08:41] the previous top strongly, so the supply is completely in control. We mark the body of the first candle as a reference point for the beginning of this upward movement. The structure is clearly bullish, and we anticipate the price to continue pushing upward after
[08:56] a pullback. However, if the price suddenly drops and closes below the demand area, showing a sudden reversal of bullish momentum, this condition is known as a change in the state of delivery.
[09:08] So, what does this signify in terms of price action? First, it indicates that the breakout was actually a fakeout, designed to target liquidity above this market structure level.
[09:21] Also, a break below the demand level reveals that buyers failed to support their long positions and sellers have now taken control. This sudden shift in the market momentum signals a potential reversal to the downward.
[09:34] So, how can we use this concept to enter a trade? At this point, our market bias has shifted to bearish, meaning we are only looking for opportunities to sell. After the breakout, we know that what was once support has now turned into resistance.
[09:50] This change in market structure provides us with an important signal. When the price pulls back to this supply area, it creates a great opportunity to enter a short trade, since this zone, which was previously a demand level, now acts as supply.
[10:06] By entering a short position at this point, we can take advantage of the bearish momentum, giving us a high-quality trade setup with a good risk-to-reward ratio. The same concept applies to the bearish scenario.
[10:20] Although similar, the change in the state of delivery and change of character have some key differences. Change of character happens when the price breaks through a well-defined market structure, signaling a shift in the overall trend.
[10:36] CISD, on the other hand, is more focused on a sudden momentum shift to the opposite side and can signal a market structure shift earlier than a change of character. However, it's important to note that not every change in the state of delivery pattern you see on the chart
[10:51] will lead to a successful trade, especially if it occurs in the middle of nowhere with no clear structure or context. To trade CISD effectively, it must align with other market factors and conditions.
[11:04] Through backtesting, we have realized that CISD patterns are most effective when accompanied by specific conditions. To ensure a valid CISD and to enter a high-quality trade, certain rules need to be followed.
[11:17] So, let's discuss the key conditions that enhance the reliability of a CISD pattern. Rule number one, rejecting a higher timeframe key level. As mentioned earlier, the CISD is a reversal price action pattern,
[11:33] and it's most effective when it occurs after the price has tapped into a higher timeframe key zone. This is because key levels on higher time frames, such as four hours, daily or weekly, have the power to influence the price movement significantly.
[11:47] When the price reaches these zones and CISD forms, it indicates that the market is likely reversing at a crucial area, making the pattern more reliable. Without this higher time frame confluence, the CISD could occur in an area where the market isn't likely to experience a meaningful shift,
[12:04] reducing the trade's probability of success. Rule number two, sweeping a liquidity pool. A high-quality CISD setup often occurs after the market sweeps liquidity from one side.
[12:18] Liquidity pools form around obvious equal highs and lows where traders place stop losses. When the price sweeps these levels, it triggers those stops, engaging liquidity and setting up a potential reversal.
[12:30] Once this liquidity is taken out, the price is more likely to reverse in the opposite direction, making it an ideal condition for a CISD pattern to form. This is a strong signal that the market has gathered enough momentum for the reversal, increasing the
[12:44] validity of the setup. Rule number three volume and confirmation For a valid CISD setup it important to focus on the trading volume and price momentum The price momentum and volume can often be identified through the formation of fair value gaps
[13:03] For example, here, notice how the latest breakout forms an area of fair value gap, indicating significant bullish momentum, but suddenly price drops, shifts direction, and also forms another bearish FVG.
[13:17] These gaps are a visual representation of heightened activity and volume in the market. When you spot a CISD forming alongside a fair value gap, it provides a clear sign that institutional traders or large participants are behind the move, adding further credibility to the setup.
[13:33] A price retracement into the fair value gap can offer a high probability entry point. The market often fills these gaps before continuing in the direction of the new trend. By combining volume, fair value gaps, and CISD,
[13:48] you can significantly increase the likelihood of a successful trade while minimizing risk. By following these rules, ensuring the CISD occurs at a key level, watching for volume confirmation, and waiting for a retest,
[14:01] you increase the chances of identifying high-quality trade setups with strong potential for profit. Finally, we have ICT's Optimal Trade Entry, or OTE.
[14:16] This strategy mainly relies on Fibonacci retracement levels and key price swings to predict the start of strong impulsive moves and set potential targets. Imagine we're in an uptrend and want to buy low and sell high to take advantage of the bull market.
[14:32] We can't just jump into a buy trade right now because the price is too high and could drop at any moment. Instead, we need to wait for a pullback to enter at a better price. The latest impulsive move started here and pushed higher to this point.
[14:47] The correction will take place within this range, and once the market gathers enough liquidity and buyers step in, the price is likely to continue moving higher. Now, the big question is, where should we enter our long position?
[15:01] If we enter too early, the price might pull back deeper, stopping us even if our analysis was correct. But if we wait too long, the price could reverse before we enter, causing us to miss the trade.
[15:13] The key to trading with the trend is to pinpoint the end of the correction, the point where the next impulsive move begins. But how do we find it? This is where Fibonacci retracement levels come in.
[15:25] We apply this tool from the start of the impulsive wave to the end to define the correction range. When we do this, several retracement levels appear, each acting as a potential support zone.
[15:37] However, two specific levels create ICT's optimal trading zone, the 61.8% and 78.6% retracement levels. These levels offer multiple advantages, including a better risk-to-reward ratio, safer entries, and more reliable stop-loss placements.
[15:56] Now, let's combine the optimal trade entry with fair value gaps. In this example, we're in a clear uptrend. We wait for a pullback to enter a long trade at a better price.
[16:09] If the price drops below this level, it could signal a shift in momentum and put the uptrend in question. By applying the retracement tool, we define the correction range and identify the optimal trading zone.
[16:22] Looking to the left, we can see that the latest impulsive move has created multiple fair value gaps, one of which aligns with our optimal trading zone. When the price retraces into these areas
[16:35] they act as strong support and increase the chances of a bullish continuation. A more conservative approach is to set our buy limit at the third fair value gap inside the OTZ.
[16:47] This reduces the risk of becoming a victim of liquidity traps. In summary, combining the optimal trading zone with fair value gaps helps us identify strong supply and demand areas, leading to high-quality trade setups.
[17:02] That's it for today. If you found this helpful, don't forget to like the video and subscribe for more trading insights. See you in the next one.