
The 90-Year-Old Secret: Waves Predict Stock Trends
45sReveals a timeless, mysterious theory with a bold claim, sparking curiosity and debate.
▶ Play Clip"The title promises a thorough explanation, and the video delivers a solid intro, but it's padded with a blatant self-promotion break and R.S of the same points, landing in the mid-fifties."
This video demystifies the Elliott Wave Theory, framing it as a descriptive tool for market patterns rather than a predictive crystal ball. It walks through the five-wave advance and three-wave decline structure, the three critical rules, nested fractals, and practical application with volume confirmation, while acknowledging the subjectivity and common mistakes in wave counting.
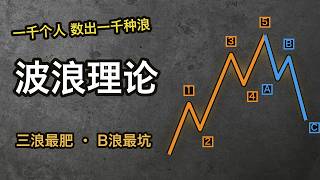
Market movements are compared to ocean waves — they ebb and flow in predictable patterns of five waves up and three waves down, forming an eight-wave cycle.
In the 1930s, an accountant named Elliott observed that market trends follow a pattern: five waves up (motive waves) and three waves down (corrective waves).
Many lament that a thousand people could count a thousand different wave patterns, highlighting the subjective nature of the theory.
Prices are driven by human emotions—optimism surges and fear contracts — making emotional waves a natural underlying driver of market moves.
Wave 1 is an initial tentative move, wave 2 is a pullback that shouldn't break wave 1's start, wave 3 is the strongest and often the longest, wave 4 is a pullback, and wave 5 is a final push with less power than wave 3.
After the five-wave advance, a three-wave correction follows: A pulls back, B is a misleading rebound (the most treacherous wave for many), and C is a deep fall with high downside risk.
Rule 1: Wave 2 cannot break below the start of wave 1. Rule 2: Wave 3 cannot be the shortest among waves 1, 3, and 5 (though it can not be longest). Rule 3: Wave 4's low cannot overlap into the price territory of wave 1.
Waves are self-similar: a wave 3 can be broken down into a full 5-3 minor cycle, and that minor wave 3 in turn contains smaller 5-3 sequences. This nesting exists across timeframe from weekly to minutes.
Start by identifying the direction via larger timeframes (weekly/monthly) and then locate positions with smaller timeframes; do not use minute-level waves to override monthly-level direction.
The presenter mentions their own quantitative system that displays charts, indicators, and market data in one interface, with backtesting capabilities, but notes the manual download/install in a pinned video for those interested.
Wave counting is easy in hindsight, but in real-time, ten experts can count ten valid pattern. Moreover, interpretations can be re-lestened, but lost money cannot be recovered.
Wave theory is a language to describe markets, not a crystal ball to predict them. It is useful as a signpost, not as a guidance system.
First, use the three laws to eliminate invalid counts, eliminating a large portion of false signals. Second, identify the rough phase (mid-impulse or late-stage). Third, use volume to confirm waves—wave 3 should have volume, wave 5 often shows volume divergence.
Focus on wave 3 (breakout above wave 1 high with volume expansion, the most profitable segment) and the B wave (price fails to exceed previous high, volume shrinks, false break – this is your last retreat opportunity, not a new trend).
If the wave count is unclear, it likely means the market itself is undecided. In such cases, stay out – there's no shame in sitting on the sidelines.
Mistake 1: treating count as fortune-telling and half-frogging into a reversal just because a five-wave impulse appears complete. Mistake 2: refusing to admit errors and re-annotating counts when price goes against you, turning a wave 2 into a wave C and ending with a halved account.
Waves represent human psychology – doubt, acceptance, euphoria, withdrawal. Elliott just formalized this emotional cycle into a framework of five up and three down; the framework may be delayed or mutant, but the emotional cycle has never been absent.
1) Check the three iron laws against any count. 2) Determine whether you're in a motive or corrective phase—don't snap Bounce in wave C. 3) Confirm volume alignment – wave 3 surges, wave 5 tapers, B wave rebound has even lower volume. If volume doesn't fit, discard the count.
Step 1: Set the level—review weekly/monthly for direction, then use daily to position. Step 2: Count structure using the three laws to extract one or two plausible counts, not aiming for a perfect answer. Step 3: Wait for confirmation—volume break or breakout below key levels as the signal to act.
Five waves up, three down. Wave 3 is the fattest, wave 4 is the most treacherous. Use the laws for filtering, confirm with volume. Waves are signposts, not crystal balls. Interested in running your own backtests? The quantitative system download/install guide is in the pinned video.
Like, comment, subscribe to [YouTuber]'s quant channel.
Waves are descriptive, not predictive
Reframes the whole theory – a crucial mindset that separates profitable traders from those who treat it as a crystal ball.
03:15Wave B is the biggest trap
Identifies the most deceptive part of the correction pattern, warning traders against chasing a rebound that often leads to heavy losses.
01:14Three iron rules prevent most miscounts
Provides a clear, objective filter to eliminate countless fake wave counts, grounding the theory in testable constraints.
01:34It's all about emotions
Explains why waves repeat: human psychology cycles from doubt to fear, driving market behavior patterns.
04:32[00:00] 站在海边看浪 一排接一排 涌上来 退回去 再涌上来 从来不是一口气漫上沙滩 90年前 一个叫艾德特的会计 盯着古诗图看了几年
[00:12] 说了句狠话 古诗的走势 跟海浪一个脾气 上是五个浪飞上去 跌是三个浪退回来 八个浪一个轮回 但江湖上也有句吐槽
[00:24] 一千个人去数浪 能数出一千种浪 今天把快乐和痛苦 一次讲透 先说埃里特到底看见了什么 王兴从来不走直线 涨一段 歇一段 再涨一段 上浪 涌三步
[00:36] 退一步 因为推着价格走的是人心 乐观的时候往前涌 害怕的时候往回缩 情绪本来就是一波一波的 波浪里面要干的事 就是给这些起步编号 搞清楚现在踩在第几个浪上
[00:49] 先看上半场 推动浪 12345 第一浪是先投部队 试探着涨 没几个人信 二浪回调 把不坚定的洗下去 但他跌不破一浪的起点 三浪
[01:01] 主升浪 全场最猛 通常最长的一段 放量 消息短短 所有人都看明白了 四浪歇脚 五浪冲紧 五浪看着热闹 力气其实不如三浪 是最后的冲刺 赶完了
[01:14] 该还了 下半场 三个调整浪 A浪 B浪 C浪 A浪先跌一段 多数人以为只是回桥 还在低息补仓 B浪反弹是八个浪里最坑的一段看着要创新高其实是又多老手管它叫逃命浪当C浪杀下来又急又深杀伤力最大
[01:34] 到这儿 一个轮回才算走完 浪不是随便数的 艾特留了三条铁律 一条都不能破 第一条 二浪再深 不能跌破一浪的起点 破了 说明这波上涨根本没成立
[01:46] 第二条 三浪可以不是最长的 但绝不能是一 三 五里最短的那个 第三条 四浪的低点 不能踩进一浪的价格区域 破了任何一条
[01:58] 不是行行错了 是你数错了 擦掉重数 波浪理论最妙的一层 浪的肚子里还有浪 把三浪单独放大 里面又是一套完整的小五浪 再把小三浪放大
[02:10] 里面还有更小的五浪 从月线到日线 再到分钟线 同一套结构层层嵌套 这叫分形 大浪套小浪 分数浪先定级别 看大浪定方向
[02:22] 看小浪找位置 别拿分钟线的浪去推翻月线的浪 讲到这儿可能有人想问 这些浪形量能平时拿什么看 其实我自己搭了一套量化系统在辅助
[02:34] 配线 指标 行情都在一个界面里 切个周期就能换级别 资金流向 龙虎榜 回测引擎 策略库 一个想法靠不靠谱 让回测拿历史数据跑一遍
[02:46] 胜利直接摆给你看 想自己上手 完整量化回测系统下载和安装 请看置顶视频 好 回正题该说说数浪的痛苦了波浪理论的快乐再回头看每一段行情都数的明明白白像写好的剧本痛苦再往前看
[03:03] 同一张图 十个高手能数出十种浪行 谁听的都有道理 最要命的是 数错了还能改 行情一走反 把标号擦掉重标 永远符合理论 可你的钱回不来
[03:15] 所以记住 波浪理论是描述行情的语言 不是预测行情的水晶球 那它还有用吗 有 前提是摆正位置 当路标 别当导航 第一
[03:27] 用三条铁律做排除法 违反铁律的术法 直接扔 能扔掉一大半477人 第二 指定大概阶段 现在更像主生的中段 还是冲顶的末段 模糊的正确
[03:39] 好过精确的错误 第三 哪辆能对答案 三浪该放量 五浪常缩量 浪形和量能对上了 才算数 说到实战 普通人盯住两段就够了
[03:51] 一段是三浪 突破一浪高点 量能放大 抖得又抖又稳 全场最肥的一段 顺着拿住 另一段是B浪 冲心高冲不过去 量越弹越小 向上涨 其实是最后的撤退机会
[04:03] 别把它当新行企 再送一条保命的 浪数不清的时候 说明市场自己也没想好 看不懂 就不参与 讲了两个最常见的坑 一个 把数浪当算命 数出个五浪将近
[04:15] 就重仓去压反转 浪形是概率 不是判决书 压错一次 伤筋动骨第二坑行情走反了不认错改标号应援这是二浪回调一路改到这是C浪账户已经腰斩理论永远圆的回来本金圆不回来
[04:32] 说到本质 波浪数的不是价格 是人心 怀疑 认可 疯狂 退潮 情绪天然一波一波 埃里特只是把这个结构 化成了五上三下的模板
[04:45] 模板会迟到会变形 但情绪的轮回 从来没缺席过 那怎么快速上手 记住三看 一看铁律 三条铁律先过一遍 不合格的术法直接扔 二看阶段
[04:57] 分清推动还是调整 别在C浪里抢反弹 三看量能 三浪放量 五浪缩量 B浪反弹量更小 量能对不上的浪形 别信 总结正确姿势 用波浪理论
[05:10] 记住三步 第一步定级别 先看周线月线的大浪 搞清大方向 再到日线里找位置 第二步数结构 用三条铁律做排除 留下一两种最像的数法
[05:22] 别追求唯一答案 第三步 等确认浪形只给剧本 放量突破或者跌破关键位 才是开拍的信号 这就是把航行当海浪读的功夫
[05:35] 波浪理论 记住 五浪推上去 三浪退回来 三浪最肥 地浪最坑 铁律做排除 量能最大 数浪是路标 不是水晶球 想跑你自己的回撤
[05:47] 完整量化回测系统下载和安装 这顶视频里有 点赞 收藏 关注小宇量化 全网同名
⚡ Saved you 0h 05m reading this? Transcribe any YouTube video for free — no signup needed.