
The Hidden CRT Model Smart Money Uses
45sReveals a 'hidden' advanced trading model, tapping into the curiosity and desire for exclusive knowledge.
▶ Play Clip"The title promises a life-changing candle, but the content delivers a solid, detailed trading model—just with a bit of hype."
This video presents a refined version of Candle Range Theory (CRT), an advanced trading model that identifies market manipulation phases to align with smart money. The presenter explains how to use session behavior and kill zones to anticipate high-probability setups, with detailed entry and exit strategies on lower time frames.
The video introduces Candle Range Theory (CRT) as an advanced trading model, claiming it has been hidden from most ICT/SMC communities and can deliver A+ setups.
Every higher time frame candle represents a trading range composed of multiple lower time frame candles. These ranges can be swept, broken out, or retested, providing information about market sentiment.
The market moves through three phases: Accumulation, Manipulation, and Distribution (AMD). Price constantly cycles through these phases even within a single higher time frame candle.
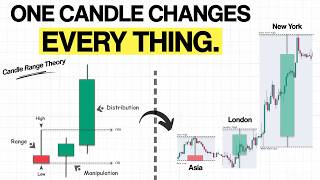
The simplest CRT model uses a three-candle sequence: the first candle defines the trading range (accumulation), the second sweeps liquidity (manipulation), and the third distributes toward the next liquidity pool.
Price typically accumulates during the Asian kill zone, manipulates during the London kill zone (often forming the day's high/low), and distributes during the New York kill zone. The London close is often an ideal profit-taking window.
The 15-minute chart is recommended for recognizing patterns due to clean price action and structure. However, scenarios are not absolute; price is never fully predictable.
Manipulation occurs at session opens when new liquidity enters, retail traders are active, and smart money creates fake moves to trap traders and collect liquidity before delivering the real move.
CRT can form with more than three candles; the key is identifying the manipulation phase and the range candle, regardless of the number of candles.
Instead of fixed hours, the model uses the highest and lowest 15-minute candles of the previous session or kill zone as range candles, as manipulation often sweeps liquidity around these levels.
After a liquidity sweep and reversal, zoom into lower time frames (1-min or 5-min) for entry models. On 1-min, look for an inversion fair value gap (IFVG); on 5-min, look for breaker blocks or mitigation blocks.
Two entry options: enter immediately after IFVG forms at next candle open, or place a sell limit at the IFVG low. Take profit targets include the range candle low, Asian session midpoint/low, or fixed R:R (2.5R-3R).
If the first trade is in profit, look for a new bearish fair value gap during a pullback to add a second position, with stop loss above the recent swing high.
For 5-min entries, use breaker blocks (swing high, swing low, higher high, then bearish expansion) or mitigation blocks (swing high, swing low, lower high, then bearish displacement). Place sell limits at the zone low.
Using the 15-min chart, highlight Asia's highest/lowest candles, wait for London open, and monitor for a sweep. On 1-min, a bearish IFVG formed after the final sweep, leading to a sell limit at the IFVG low, targeting 2.5R, which hit.
For the New York session, use London's range candles. After a sweep below London, a 1-min bullish IFVG formed, leading to a buy at next candle open, targeting 2.5R, which hit.
The video provides a comprehensive, step-by-step CRT model that combines session behavior and manipulation logic to identify high-probability trades. By focusing on the manipulation phase and using dynamic range candles, traders can align with smart money and improve their trading consistency.
What are the three phases of market movement in CRT?
Accumulation, Manipulation, and Distribution (AMD).
01:43
What is the role of the first candle in the three-candle CRT sequence?
It defines the trading range and is where most accumulation happens.
01:56
What happens during the manipulation phase?
Smart money traps traders by creating a fake sharp move, taking their liquidity before reversing.
02:39
What is the typical session behavior for price in CRT?
Price accumulates during the Asian kill zone, manipulates during the London kill zone, and distributes during the New York kill zone.
03:17
What time frame is recommended for recognizing CRT patterns?
The 15-minute chart.
04:12
Why does manipulation happen at session opens?
Because new liquidity enters, retail traders are active, and smart money uses that moment to create fake moves and collect liquidity.
05:34
How does the presenter's CRT model select range candles?
By using the highest and lowest 15-minute candles of the previous session or kill zone, rather than fixed hours.
08:02
What is the first layer of confirmation in the CRT model?
Price entering a range candle, sweeping its liquidity, and immediately reversing back inside the range.
08:44
What entry model is preferred on the 1-minute chart?
An inversion fair value gap (IFVG) forming right after the liquidity sweep.
09:14
What entry models are preferred on the 5-minute chart?
A breaker block, mitigation block, or IFVG that forms after the manipulation move.
09:29
What are the two entry options after the IFVG forms?
Enter immediately at the next candle open, or place a sell limit order at the lowest point of the IFVG.
10:10
What are the take profit options in the CRT model?
Target the lowest point of the 15-minute range candle, the Asian session midpoint or low, or a fixed risk-to-reward like 2.5R or 3R.
11:08
What is the difference between a breaker block and a mitigation block?
A breaker block requires a higher high after the swing low, while a mitigation block requires a lower high.
12:56
AMD Phases
Provides a clear framework for understanding market cycles, essential for CRT.
01:43Session Kill Zones
Offers a practical timing tool to anticipate manipulation windows.
03:17Dynamic Range Candle
Improves on classic CRT by using session extremes instead of fixed hours, increasing accuracy.
08:02IFVG Entry Model
Provides a precise, mechanical entry trigger on lower time frames.
09:14Breaker vs Mitigation Blocks
Clarifies two distinct 5-minute entry patterns, avoiding confusion.
12:56[00:02] In today's video, I'm going to break down the candle range theory model, an advanced trading model that has been kept hidden from most of the ICT and SMC community, yet has the potential to consistently deliver A+ setups.
[00:15] But this is not the basic CRT you've seen before. I'm going to show you a refined version of candle range theory, a model that allows you to identify the manipulation phase and align yourself with smart
[00:27] money instead of getting trapped by it. I'll break down my personal CRT model step-by-step, combining it with session behavior and manipulation logic to give you a clear, mechanical way to find high-probability setups. So, make sure
[00:42] you watch this video until the end, because once you understand this, you'll never look at candles the same way again. Let's get into it.
[01:01] started. Before we go any further, let's first actually is. According to candle range theory, or the CRT model, every single candle on your chart represents a trading range. In
[01:16] other words, each higher time frame candle is simply a range of price action made up of multiple lower time frame candles when you zoom in. And because every range can be swept, broken out, or retested, all of these
[01:29] candlestick patterns. That gives us valuable information about market sentiment and creates excellent trading opportunities. The market moves through three main phases: accumulation, manipulation, and
[01:43] distribution, AMD. Price is constantly cycling through these phases, even inside the range of a single higher time frame candle. But with CRT, we are not focused on just one candle.
[01:56] The simplest CRT model is built around a three-candle sequence, and each candle important role. The first candle, and the most important one, defines the trading range. Most of the accumulation usually happens
[02:11] inside this candle. This is the critical candle because identifying the correct one is what allows you to anticipate the reversal before it happens. The second candle sweeps the liquidity
[02:23] This is exactly where the manipulation phase happens, and the third candle is where price is most likely to distribute toward the next key liquidity pool. sequence down into lower time frame candles, you'll notice that the
[02:39] manipulation phase is where your main focus should be. This is the phase where the market traps other traders by creating a fake sharp move, taking their liquidity before reversing.
[02:51] This manipulation phase is also where smart money usually enters the market, and it often happens during specific time windows, right before or after a time windows, right before or after a major session open or kill zone.
[03:03] In my specific CRT model, the goal is to identify this manipulation phase early enough to enter with smart money instead of getting trapped on the opposite side. So, to do that, you need to understand exactly when manipulation is most likely
[03:17] And for that, the first thing you need to understand is session behavior and kill zones. Price usually accumulates during the Asian kill zone, manipulates during the London kill zone, often forming the
[03:30] day's high or low, and then distributes during the New York kill zone. The London close is often the ideal profit-taking window where the price day. However, if price expands instead of
[03:45] accumulating during the Asian kill zone, then you should not expect London to manipulate right away. Instead, London is more likely to accumulate, which means the manipulation phase is more likely to happen during
[03:58] the New York or London close kill zones. So, in the end, it all comes down to what the Asian session did first. If you check the Asian kill zone first, it gives you one of the most accurate ways to anticipate the market's next likely
[04:12] When it comes to time frames, the 15-minute chart is your best option for recognizing these patterns because it gives you clean price action while still structure. But, keep in mind, none of these
[04:27] scenarios are absolute. Price is never fully predictable, and behaviors. For example, if price consolidates during Asia and the London session manipulates by sweeping Asia's low
[04:41] before continuing higher, then you can expect New York to come back, take out the lowest point of the London session, and then distribute to the upside. On the other hand, if the Asian session accumulates and London moves higher
[04:55] without fully completing the manipulation by sweeping Asia's low, then New York may liquidate deeper, taking out both the Asia and London lows before making the real move. So, the market is never fully
[05:08] predictable, and we can't expect it to behave like a fixed road map. That's why our main focus should only be on spotting signs of manipulation around the opening of every major session or kill zone because that is exactly where
[05:21] we build our trading plan and align ourselves with institutional money instead of trading against it. Now you might ask, why does this type of Now you might ask, why does this type of manipulation happen?
[05:34] same time. New liquidity enters the market. Fresh orders flow in instantly. Retail traders become most active, and smart money uses that exact moment to manipulate price, create a fake move,
[05:50] trap traders, collect liquidity, and then deliver the real move they intended from the beginning. Also, keep this in mind. The CRT model does not always have to be a strict three candle sequence. It can also form
[06:04] candles. The only difference is that the classic three candle sequence usually forms over a shorter period of time. same. Whether it forms with three candles or
[06:17] more, the most important thing for us is the manipulation phase and the candle For example, let's say we have a clear buy side liquidity pool resting just above this bullish range candle. What happens next is that price first
[06:32] accumulation phase. Then it manipulates by sweeping the high of that range, and after that, it enters the distribution phase, showing us that price is now likely to continue lower.
[06:46] That gives us a clear bullish continuation. So here we've already seen the full power of three, accumulation, manipulation, and distribution. Once again, a range forms. Liquidity gets taken, and then price expands
[07:01] upward, eventually reaching the high of that range. It's the same idea in this example as well. A range candle forms, but this time it takes a bit longer for the price to sweep the low of that candle. Then,
[07:14] almost immediately, price reverses, moves toward the high of the range, and That's exactly why identifying the true range candle is so important. Because your job is not to treat every large candle that appears around a key
[07:29] time as the range candle, your job is to identify the real one, the candle after where smart money truly enters the market. Now, let's break down the details of my specific CRT model and go step-by-step
[07:45] through how to execute trades based on it. candle. The classic CRT model usually uses fixed key times like 1:00 a.m., 5:00 a.m., 9:00 a.m., and so on to define the range
[08:02] candle. But in my specific CRT model, I use a more dynamic method. Instead of relying on fixed hours, I focus on the highest and lowest 15-minute candles of the previous trading session or kill zone
[08:17] and use those as my range candles. The reason is simple. When a new session begins, manipulation often happens by sweeping the liquidity resting above or below these exact candles. For example, if you're trading the
[08:31] London session, the first step is to highlight the highest and lowest 15-minute candles from the Asian session as your potential range candles. Then wait for London to open and monitor price action closely.
[08:44] Once price enters one of those upper or lower range candles, sweeps its liquidity, and immediately reverses back inside the range, that becomes our first layer of confirmation. From there, we zoom into a lower time
[08:59] frame, such as the 5-minute or 1-minute chart, to track the higher time frame confirmations. This is where your entry model must appear before opening a trade. At this stage, if I'm using the 1-minute
[09:14] chart, I usually prefer to look for an inversion fair value gap forming right after the liquidity sweep. But if I'm using the 5-minute chart, I prefer looking for a breaker block, mitigation block, or IFVG
[09:29] that forms after the manipulation move. Now, in the next step, if we are using the 1-minute time frame, we look for a violated fair value gap gap. This becomes our second layer of
[09:44] confirmation. Once the IFVG forms, it often acts as a new resistance level, giving us a strong area for a potential sell entry. And if a market structure shift happens at the same time, that adds another
[09:57] powerful layer of confluence and makes the setup even stronger. With these confirmations in place, we can expect price to retrace back into the IFVG, now acting as resistance, before
[10:10] continuing lower toward the next sell-side liquidity pool. For placing an entry using this model, you have two options. mind that you can always add extra confluences, such as a V-shaped recovery
[10:25] or a change in the state of delivery. That said, extra confirmation can be a double-edged sword. It may improve reliability, but it can also cause you to miss the trade if the market moves fast.
[10:37] entry. Option one, enter immediately after the IFVG forms by opening your position at the next candle open, with the stop-loss placed above the most recent swing high.
[10:52] Option two, place a sell limit order at the lowest point of the newly formed IFVG and wait for the price to retrace into the zone and activate your entry. For take profit, you have a few choices. You can target the lowest point of the
[11:08] 15-minute range candle, or if you're aiming for a bigger move, target the aiming for a bigger move, target the Asian session midpoint or the Asian low. Another clean approach is using a fixed risk-to-reward target, like 2.5R or 3R,
[11:22] risk-to-reward target, like 2.5R or 3R, depending on your style. started moving in my expected direction and my first position is already running in profit while there is still enough room for price to continue lower.
[11:37] I often look for an add-on continuation entry. This usually happens when price creates a new bearish fair value gap during the break of structure. In that case, the next unmitigated
[11:51] bearish fair value gap becomes our second entry point where we can place another sell limit order with the stop loss a few pips above the most recent swing high. However, if you choose the 5-minute
[12:04] chart as your entry time frame, then right after the liquidity sweep and manipulation, you should look for either a breaker block or a mitigation block. For a valid bearish breaker block, the price should first create a swing high,
[12:17] then a swing low, followed by a higher high. After that, we need to see an immediate bearish expansion that breaks the structure and confirms the shift. In this case, the down close candle or
[12:30] series of down close candles formed between the first swing high and the zone. This is the area where we plan our short The next step is to place a sell limit order at the lowest point of that
[12:43] breaker block and wait for the price to retrace into it. Now, keep in mind, this is different from a mitigation block because with a mitigation block, we look for a lower high, not a higher high.
[12:56] So, for a valid bearish mitigation block, price must first create a swing high, then a swing low, followed by a lower high. After that, we need to see a strong bearish displacement that breaks below
[13:08] the previous swing low. In this case, the mitigation zone becomes the last down close candle or series of down close candles formed between the first swing high and the swing low.
[13:21] Then we place a sell limit order at the lowest point of that mitigation block with a stop loss a few pips above the nearest swing high and wait for the price to retrace into the zone. And just like the 1-minute IFVG model,
[13:35] if the first trade is already running in profit, we can always add another position as a continuation setup if price forms a new bearish fair value gap during the next pullback. In that case, the next unmitigated
[13:48] bearish fair value gap becomes our second entry zone. Now, let's put real chart examples to see how we approach different market scenarios.
[14:00] Here we have the euro-dollar 15-minute chart on the screen. As you can see, the Asian session has just ended and London is about to open with the Frankfurt pre-market. So, to apply our CRT model, the first
[14:13] thing I do is highlight the highest and lowest 15-minute candles of the Asian lowest 15-minute candles of the Asian session as my CRT range.
[14:41] Wait for the London open and monitor price until it enters one of those CRT price until it enters one of those CRT range candles. pushing toward the upper CRT range, which tells us it's more likely to sweep
[14:54] the liquidity above the Asian session first. signs. Now, here on the 1-minute chart, you can
[15:10] clearly see that after sweeping the liquidity above Asia, price immediately drops back inside the 15-minute CRT range. range. At first, price created a bearish IFVG,
[15:22] but we did not take that first one. And the reason is important. Inside the bullish impulse leg that caused the first liquidity sweep, we did not have a valid CISD confirmation. A close below the bullish candles that led
[15:35] into the sweep. So, if we had ignored the CISD rule and entered from that first IFVG, the stop loss would most likely have been hit. But, then price performed the final and main liquidity sweep.
[15:52] bearish IFVG inside the final impulse leg. manipulation. That gives us the full confirmation.
[16:05] So, now we can expect price to retrace back into that IFVG, now acting as resistance, before continuing lower toward the next sell side liquidity At this stage, I place a sell limit order at the lowest point of the
[16:19] 1-minute IFVG inside the 15-minute CRT range with the stop loss above the recent swing high, and I set my take profit at a fixed 2.5 R to R. Now, let's play the chart forward. As you can see, the sell order gets
[16:34] triggered. Price retraces perfectly into the IFVG and then drops with momentum straight into the take profit. Now, here's where it gets even more interesting. If you look closely, price has now
[16:47] formed a market structure shift, which could signal the formation of a higher time frame breaker block or mitigation block. So, because of that, let's zoom out to the 5-minute chart and see if we can find a second entry.
[17:03] looks even cleaner. We have the liquidity sweep above Asia. Price drops back inside the CRT range, and then forms a clean bearish 5-minute mitigation block. We have a swing high then a swing low
[17:16] followed by a lower high, and finally a bearish displacement that closes below the first low, that confirms the bearish mitigation block. So, in this case, the mitigation zone becomes the large down close candle formed between the first
[17:29] swing high and the swing low. Since the zone is relatively large, I choose to place my sell limit order at the midpoint to get a better risk to reward ratio with the stop loss above the swing high.
[17:43] For take profit, I target the Asian session low.
[17:55] As you can see, price pushes slightly higher, gives a small drawdown, then quickly reverses with strong downside momentum, and eventually hits the take profit, once again proving how effective this CRT model can be.
[18:09] Now, let's move on to the next real chart example. Now, here once again, we have the Euro Dollar 15-minute chart on the screen. As you can see, the New York session is about to open. So, the first step is to
[18:22] identify the upper and lower CRT range candles of the London session. open, it pushes lower and sweeps the liquidity resting below London.
[18:41] inside the 15-minute CRT range. That's our first sign of manipulation. The next and wait for an entry model to appear before opening a position. Now, here on the 1-minute chart, everything looks clean.
[18:56] price immediately pushes back up into the 15-minute CRT range. happens next. Now, as you can see, after entering the manipulation phase, price pushes higher and first forms a CISD confirmation.
[19:24] value gap, flipping it into an inversion fair value gap. Once the IFVG forms, it is likely to act as a new support zone, giving us a strong area for a buy entry. So, in the next step, I immediately open
[19:39] a buy position at the next candle open right after the IFVG forms with the stop low. For take profit, I target the nearest
[19:51] buy side liquidity on the current time frame, which gives us almost a 2.5 R to frame, which gives us almost a 2.5 R to R.
[20:10] the price pushes higher with momentum and eventually hits our take profit cleanly. That's it, traders. Thanks for watching. I hope you found this video valuable. If you did, hit subscribe and turn on
[20:22] notifications so you never miss an update. Drop a comment below with your thoughts or topics you'd like to see next.
⚡ Saved you 0h 20m reading this? Transcribe any YouTube video for free — no signup needed.