

Smart Money Concepts: The Ultimate Edge
45sOpens with a bold claim that smart money is the 'coolest' trading style, promising high reward-to-risk ratios, which hooks traders seeking an edge.
▶ Play Clip"Delivers solid smart money concepts and setups, but padded with repeated subscription requests and some fluff."
This video provides a comprehensive introduction to Smart Money Concepts (SMC) for trading, covering fundamental principles like identifying market control, supply and demand zones, market structure, and liquidity. It then details three specific trading setups with rules and real chart examples, along with backtesting results.
Smart money trading allows analyzing any pair easily by knowing what to look for on the chart, enabling high risk-to-reward ratios without complexity.
Identify market direction by monitoring mitigations: if price mitigates a demand level, demand takes control; if it mitigates a supply zone, supply takes control.
Breaking below a valid demand area is a change of character, indicating supply is taking control and a valid supply area has formed.
At an unmitigated demand area, three scenarios can occur: break down (short aligned with downtrend), break up (CHoCH, long aligned with uptrend), or consolidation (range trading).
In an uptrend, higher highs and higher lows; breaking structure creates demand levels. A break and close below a swing low signals a valid change of character.
A gap below an order block acts as a magnet; if another order block is below, the break may be a liquidity grab, not a valid CHoCH.
An order block that sweeps liquidity under equal lows is a strong indication the market will continue in the original direction.
These reversal patterns show market failure to break structure, often due to momentum loss or higher timeframe key levels, indicating a possible reversal.
Liquidity areas are where retail stop losses gather (e.g., below multiple rejections). Smart money aims to sweep these stops before entering trades.
Order blocks are optimized supply/demand areas formed by sharp moves that create inefficiency and break structure. Mark the last candle that created the inefficiency.
Find a fresh order block with obvious inefficiency, place buy limit a spread above the zone, stop below swing low, take half profit at 2R, target next key level.
Trade only with market direction, check higher timeframe key levels for room, and check left side for gaps or liquidity zones that could invalidate the trade.
Backtested 100 order block setups on EURUSD 1H using Trader Edge software, $10,000 account, 2% risk, 4% profit target. 28 setups did not trigger, 72 triggered.
Combine order blocks with liquidity sweeps below minor demand areas. A break of structure with no inefficiency may be a liquidity grab, not a valid CHoCH.
Use two timeframes: mark HTF order block, wait for price to return, then zoom into LTF (2x lower) for a change of character confirmation. Enter via order block or Fibonacci retracement (618-786).
Who is in control
Core principle: mitigation of supply/demand determines market control, guiding trade direction.
01:34Change of character definition
Key signal for reversals, essential for smart money trading.
02:12Gap as magnet
Explains why breaks may be liquidity grabs, avoiding false entries.
07:45Liquidity zones
Understanding where retail stops are helps anticipate smart money moves.
10:06Backtesting results
Provides empirical evidence of strategy performance (72% triggered, 2R targets).
15:05[00:00] Hey guys, and welcome to another episode of Smart Risk. Smart money by far is the coolest trading style out there since it allows you to analyze any pair easily and effectively by knowing exactly what you are looking for on the chart.
[00:13] It makes it possible to catch insane risk to reward ratios without making things so complicated. In this video, first, we will explain the fundamental smart money concepts which are required to apply on the charts before executing any trade.
[00:27] This includes identifying who is in control, determining optimal supply and demand areas for trading, grasping market structure concepts, and recognizing liquidity zones. Then, we will provide a step-by-step explanation
[00:41] of three exceptional smart money trading setups, along with their corresponding rules. Finally, we will provide multiple real chart examples and back-testing results to demonstrate how to apply these strategies to the market effectively.
[00:55] So guys, if this is something that interests you, make sure to smash the like button to show your support and subscribe to our channel if you are new since we publish many advanced trading concepts.
[01:19] So let's start with the fundamentals of smart money concepts. Applying these concepts to the chart is the first step we take before starting our trading day. This general analysis helps to identify everything we need to prepare for executing our trades.
[01:34] Number one, who is in control? Identifying market direction is one of the most important skills to master in supply and demand trading, since we always want a trade aligned with the controlling side of the market.
[01:46] How does the system work? It works based on simple mitigations. If the price mitigates a demand level, demand takes control over supply. If the price mitigates a supply zone, the supply takes control over demand.
[02:00] Imagine the price moving in an uptrend and making a series of higher highs and higher lows. Every time the price breaks the structure to the upside with inefficiency, a demand zone is created.
[02:12] The price hasn't tapped into these zones yet, so these demand areas remain unmitigated, providing a perfect opportunity to advance toward the dominant trend. However, breaking below this valid demand area is called a change of character
[02:24] and indicates two things. First, supply is taking control over demand. Second, a valid supply area has been formed. Then, the price continues pushing down,
[02:36] creating supply areas until we reach the next unmitigated demand area in front of the price. Now, after reaching this level, we have a fight between supply and demand, and we witnessed three common scenarios in the market.
[02:49] In the first case, the market breaks the demand level indicating a heavy bearish momentum. So if the market returns to the supply area, we could go short aligned with the dominant downtrend. On the contrary, if the market breaks the supply level to the upside,
[03:04] we have a change of character indicating the short-term downtrend is over and the price can continue pushing upwards. So, we could go long at the demand areas aligned with the dominant uptrend.
[03:16] In the final scenario, we witness a period of consolidation and a ranging market between the two zones, in which breaking each one indicates who takes control. So let's see some real chart examples on this topic.
[03:29] Here on the EURUSD one hour's time frame. Let's break down market movements individually to identify where supply and demand are in control. Starting from the left, we have a break of structure to the downside and supply is in control as long we stay below this swing high.
[03:45] Continuously we have a sharp move to the downside, breaking below the previous market structure, indicating supply is still in control. Once more, another break of structure and a valid zone we have, so supply is in control as long as we stay below this zone.
[04:00] Now if the market break and closes above this supply zone, we have a change of character which shows that supply failed to push the market lower, and demand took control. Because if supply was still in control,
[04:12] we wanted to see a rejection from this area, which could lead to another potential market structure break to the downside. So right now, demand is in control, and we want to trade with the dominant direction.
[04:25] Then, the market makes a sharp move to the upside, with a clear inefficiency leaving behind an extreme demand area. Then it continues pushing up and creating more demand areas to trade. So each of these demand areas could be a potential buying opportunity.
[04:41] The first one possibly hits our first target and makes us at least break even before the market reverses and makes a change of character. But this change of character is not 100% valid. The reason is that we have a clear inefficiency and a valid demand area right below it which could act as a magnet for the price to come and fill the gap grab the liquidity and continue pushing upwards We will discuss this concept in detail later in the market structure section
[05:07] For now, let's focus on the second setup we have. So what do we have here? We have this valid demand area, which could be a potential reversal point for the price to continue pushing upwards. We have this triple bottom, which is a perfect liquidity zone since many stop losses are
[05:22] beneath it. Also, we have the same scenario discussed previously. We have a clear inefficiency and a valid demand area right below the first one, which could act as a liquidity sweep.
[05:35] Now here is an important point. We cannot control the market. However, we can prepare ourselves for the different scenarios that might happen. Let's move on to the next topic, smart money market structure.
[05:47] The market structure holds essential information, including key levels, market direction, swing highs and lows, and potential trading opportunities. Let me show you some basic concepts about the smart money market structure.
[06:01] As you know, in an ideal uptrend, the market continuously makes higher highs and higher lows. Every time market breaks a structure to the upside, a demand level is automatically created. So as long as we stay above the zone that created the break,
[06:16] demand is in control, and the market sentiment is bullish. But if we get a break and close below this level, we call that a change of character that signals a possible reversal. The same concept applies to the bearish scenario.
[06:28] However, the problem is that the market hardly moves so clearly. So here the question is, which one of these breaks is a valid change of character? To answer this question first, we must identify our swing lows.
[06:41] In the bullish scenario, the lowest point between two consecutive highs is identified as a swing low. Here we have two consecutive highs. So the lowest point between these two is our swing low.
[06:54] So as long as the price stays above this level, it represents a bullish market, and we will only look for buying opportunities. And for a valid change of character, we need to have a candle break and close below.
[07:06] Here we have another break of the structure by this move. So the lowest point of two consecutive highs is identified as the swing low. Once again, another two consecutive highs and a swing low we have.
[07:18] So with all being said, the market sentiment is still bullish. Once again, the same concept applies to the bearish scenario. Now let me show you some of our favorite smart money and price action patterns about market structure and the psychology behind them.
[07:33] But first, we need to hear from you. Comment below and tell us what topics you want us to cover in future videos. Also, please smash the like button since it goes a long way to support us in making more videos like this.
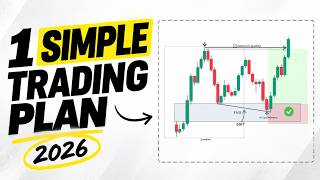
[07:45] Number one, here we have a valid order block and a potential trading opportunity to go long. But looking at the left side, we can spot this gap between the candles, precisely below the first order block and another valid order block zone here.
[07:59] Now this gap will act as a magnet for the price to come and fill it, restore the balance, grab the liquidity below the first order block, and continue pushing upwards when it mitigates the second one.
[08:11] So here are two points. First, before placing any trades, you should look at the left side to see what you have to avoid this kind of unnecessary risk. Second, when this pattern is formed
[08:23] and we have a gap and another valid order block precisely under the first one, we don't consider this break a valid change of character. Since there is a high chance for this move to be just a liquidity grab and does not necessarily mean a reversal is coming,
[08:37] On the contrary, look at the second pattern. Here we have a valid order block, and looking at the left we can see that. This move has sweeped the liquidity under these equal lows, which can fuel future movements.
[08:51] So, when this pattern is formed, and we have an order block that grabs the liquidity under or above the equal lows and highs, we have a great indication that the market can continue pushing forward.
[09:04] Number 3, Double Top and Bottoms. Top and Double Bottom are one of the best price action reversal patterns that happen every day. It simply shows that the market has failed to break the market structure and create a new
[09:16] higher high or lower low. It occurs due to several possible reasons like momentum loss, market structure shift, tapping into higher time frame key levels, and more. It is an early
[09:28] indication that the short-term trend is over and a possible reversal is coming. A fake-out or a failed breakout occurs when the price breaks through a market structure level
[09:41] but immediately gets back into the range. It shows that the sellers have failed to push the market lower due to losing momentum. On the other hand, as a smart money trader, we can identify this move as a liquidity sweep,
[09:53] so both of these concepts suggest a possible reversal Now let move on to the next concept liquidity zones Liquidity areas are where retail traders get involved in the market
[10:06] We know that multiple rejections are interesting entry levels for traditional traders, so there are many stop losses, and liquidities are gathered below them. Smart Money aims to sweep all of the retail traders' stop losses,
[10:19] and we want to enter the trade after stop losses have been swept. For more detailed information about this topic, check out our previous videos linked in the description. Now that we have discussed the fundamentals required for general chart analysis,
[10:34] let me explain three of the best smart money trading setups step by step with all the rules. But before we continue, if you have enjoyed this video so far, don't forget to smash the like button and subscribe to our channel if you're new,
[10:47] since we publish many advanced trading concepts. Now that you understand the general chart analysis and how to identify the market direction, key levels, and potential trading opportunities, let's continue with three of the best smart money entry setups.
[11:02] In this part, we will teach you step-by-step how to enter the market and set your stops and targets. But feel free to backtest and adjust these strategies to suit your trading plan and style. Let's start with the basic order block entry.
[11:16] Order blocks are optimized supply and demand areas. They form whenever we have sharp moves in the market, which creates inefficiency and breaks the market structure. Traders define order block zones in various ways,
[11:29] but here is how we mark order blocks in different market scenarios. Usually, we mark the last candle that created the inefficiency as an order block, which we believe that the decisions are made during this candle.
[11:43] Sometimes they are at the start, and sometimes they are in the middle of the heavy bearish or bullish movement as an opposite colored candle.
[11:55] Sometimes a wick grabs the liquidity after the order block candle, which we include in our zone since the safest place to set our stops is below the swing low. However, in the scenarios where we have a large order block zone,
[12:07] we look for confirmations in lower time frames to execute the trades at a better price and to have tighter stop losses. In some cases, we have a consolidation area before the sharp moves happen, which also could be a perfect order block zone to look for trading opportunities in the lower time frames and set our stop below the swing low.
[12:26] Or you could just place your orders in the middle of the order block zone to enter at a better price. Now let me explain the first smart money trading strategy with all the rules. This setup is a basic order block entry when it is aligned with certain market conditions.
[12:41] In the first step, we look for a valid and fresh order block that the market has recently created. A valid order block must have obvious inefficiency and fair value gaps between the wicks breaking the market structure.
[12:55] Then we simply place a buying order a spread size above the order block zone and place our stop below the swing low. We will close half of our position when the prices reach two times our risk. This way, even if the price drops and hits our stop loss, we are at break-even.
[13:11] For the second target, we will aim for the next key level in front of the price. But there are several key points to make this strategy more effective and profitable. Number one, always trade this setup when it is aligned with the market direction.
[13:26] This strategy is a trend continuation setup, so always trade this when you can clearly identify the market direction and who is in control. Since we always want to trade with the direction of the dominant trend to have a higher chance of winning.
[13:39] Number two, check the higher time frame key levels and how much room price has before reaching them. A small reaction to a higher time frame key level can be a major direction change in the lower details.
[13:51] When the price mitigates a higher time frame key level, there's a higher chance we will witness a temporary reversal. Also, we should always check the higher time frames to see how much room we have to reach the higher time frame key levels.
[14:05] Number three, check the left side of the structure. Before placing any trades, you should check the left side to see what you have to avoid low-quality trades. For example, if the order block has been positioned in the liquidity zone,
[14:18] or we have gaps and another order block precisely below, there is a higher chance of being a victim of a liquidity grab movement. Now let's see some examples on the real chart. Here on the EURUSD 5 minutes chart, we have an uptrend.
[14:33] The latest move has created a clean inefficiency and market structure break, leaving behind a tight order block zone. Our higher time frame direction is bullish and we have enough room to reach the next key level. So we place our buy
[14:46] limit of spread size above the order block and set our stop below the zone. Remember that whenever you have a tight order block zone like this, use a wider stop loss In the case of large zones you could place your stop a bit below the order block We have back this trading setup 100 times on Euro pair in the 1 hour time
[15:05] frame. For the back-testing, we use Trader Edge software which allows us to save so much time while back-testing our strategies. We set our initial account size at $10,000 with 2% risk, targeting 4% profits.
[15:21] Now let me show you the results we have got. From 100 order block setup, 28 did not triggered, spread size above the order block zone, and target the next level in front of the price.
[15:34] Our stop will be below the swing low, and our entry is based on combining order blocks and liquidity sweep below a minor demand area. In the bearish scenario, we have a break of structure to the downside with no inefficiency.
[15:48] We have fair value gaps precisely above the swing high, and a valid order block which which is a perfect supply zone to enter a short trade. In this case, this change of character is not valid for us, and we consider it as a liquidity grab movement.
[16:01] Then we expect the market to continue pushing in the same bearish direction when it taps into the supply zone. Here on the EURUSD 5 minutes chart, we have a moving uptrend. The market has recently broken the structure level to the upside,
[16:16] leaving behind an OK demand level. So many traders will go long if the price returns to this area, and lots of liquidity is gathered below this zone. On the other hand, looking at the left side, we can spot this clean inefficiency and a perfect order block zone.
[16:32] The institutions use this opportunity to grab the liquidity they need and push the price higher when it reaches the order block demand zone. So as explained, we will set our buy limit a spread size above the order block and place our stop below it and track our profit
[16:46] till it taps into a higher time frame supply level. Here on the New Zealand dollar 30-minute chart, we have a moving downtrend. Once again, we have a break of structure to the downside.
[16:58] So as long as we stay below this swing low, we are still in a downtrend. But looking at the left side of the structure, we can spot this clean inefficiency above this zone and a valid order block. So if the price breaks above this level, we won't take it as a valid change of character and consider it as a liquidity grab movement.
[17:15] We place our sell limit at the order block and the same rules for positioning stop loss and targets. The third trading setup is called order block in order block trading strategy. We use two time frames to execute our trades based on this setup.
[17:30] In the first step, we analyze market direction and structure and mark our higher time frame order block zone. Second, we wait for price to return to the order block and zoom into lower time frames and wait for a change of character formation to confirm our entry.
[17:45] If we see no change of character, then we won't have a trade. The change of character formation indicates that the short-term downtrend is over, and the market can potentially start to move to the upside. In this case, two common scenarios happen in the market, which is how we enter the trades.
[18:02] In the first scenario, change of character is accompanied by inefficiency and creates another order block. So we place our buy limit a spread size above the order block and place or stop below the swing low.
[18:15] In this setup, we always track our profit, meaning that every time market breaks a structure to the upside, we position our stock below the higher low. This technique allows us to get the most out of the market if it goes along with our predictions without any pressure.
[18:29] In the second scenario, the change of character move creates no inefficiency and no order block. In this case, we enter the market with the aid of Fibonacci retracement levels. We will put the retracement tool from the start of the change of character to the end.
[18:44] and place our buy position precisely in the middle of the 618 and 786 retracement levels. This trading strategy is not limited to any time frames, but remember, your entry time frame must be two times lower than your higher time frame.
[18:59] Now, let's see an example on the real chart to drive the point home. Here on the EURUSD 1-hours chart, we have a clear order block zone. First, we will wait for the price to enter the zone, and then we zoom into 5 minutes chart to look for confirmations to open short positions.
[19:16] Here on the 5 minutes chart, we can see that the market has made a change of character, which is an early signal that the bulls are losing momentum and a reversal is coming. So here, if we spotted an order block, we would place our positions based on it.
[19:30] But right now, we have no clear fair value gaps, so we enter the market with retracement levels. We will place our short entry in the middle of the 618 and 786 retracement levels and
[19:42] track our profits as long as the price goes in our favor. So guys that is it for this video. I hope this video had some value for you. If it had, please smash the like button for me and subscribe to our channel if you're
[19:54] new. See you guys in the next episodes.



⚡ Saved you 0h 20m reading this? Transcribe any YouTube video for free — no signup needed.