

10-Second Trend Line Masterclass
31sShort, clear explanation of a core trading concept that viewers can immediately apply.
▶ Play Clip"Delivers a quick crash explanation but leans heavily on personal trade narrative and lacks actionable insights."
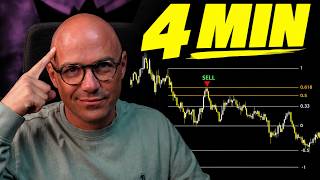
The video breaks down the recent crypto market crash, focusing on Ethereum. The speaker explains technical analysis concepts like trend lines, volume profiles, and liquidity grabs to justify why he sold Ethereum at high prices and predicts a drop to $2500.
The speaker intends to explain the crypto market crash and price predictions in under two minutes.
On October 30th, an hourly candle closed below a six-month uptrend but the daily candle showed a long rejection wick, continuing the uptrend.
An uptrend is a rising support level; losing it shows weakness and sellers take over.
Since Monday, Ethereum has dropped 11.2% after losing the support level.
In July, the speaker sold 47 Ethereum at $3700 expecting a correction, then sold the remaining 77 at $4730.
The speaker's price target is $2500, based on the daily volume profile's point of control.
The point of control is the price level where the highest volume was traded; price is likely to return there.
Markets move to grab liquidity, going low for low prices and high for high prices.
Price broke above a wedge, grabbed liquidity at highs, then cascaded from 4100 to 1300, sweeping liquidity below.
After several sweeps, price should revert to the point of control at $2500, the highest volume area.
The speaker predicts Ethereum will drop to $2500 based on volume profile and liquidity dynamics, where he plans to buy back his holdings.
What is an uptrend in technical analysis?
A rising support level.
00:34
What is the point of control in volume profile?
The price level where the highest volume of the asset was traded.
01:27
At what price did the speaker sell his remaining 77 Ethereum?
$4730.
01:12
What pattern did the speaker mention involving liquidity sweeps?
Wedge pattern.
01:58
What is the speaker's price target for Ethereum?
$2500.
01:12
How much did Ethereum drop since Monday?
11.2%.
00:48
Uptrend definition
Provides a clear, foundational technical analysis concept.
00:34Point of control concept
Explains a key volume profile metric used for price targets.
01:27Liquidity grabbing principle
Describes a core market dynamic driving price movements.
01:42Reversion to point of control
Applies volume profile to forecast price behavior.
02:25[00:00] In two minutes or less, I'm going to explain everything that I can about the crypto market crashing and where I think the price is going to go. All right, starting with Thursday, October 30th, we had a hourly candle close below a sixmonl long uptrend, which it was like, oh,
[00:17] I loved it. I'll explain why in a second. But by the end of the day, price had moved back above that trend line. So, if we look at the daily candles, we get this huge long rejection wick and a continuation on that uptrend. Now, a 10-second lesson on trend lines. An uptrend
[00:34] like support and resistance is a rising support level. So, the support continuously rises until the buyers lose that level and they show weakness at that level. That's when the sellers take over.
[00:48] Vice versa for a downtrend. So, we had that support. it pushed it above and they lost it immediately after. And since Monday, we've gone down 11.2% on Ethereum. Now, if you watched a
[01:00] previous video of mine where I share my crypto profits and what I've made so far this year, uh, in July, I sold 47 Ethereum at the 3700 level, assuming we would have a sharp correction down.
[01:12] Price continued up and I sold my remaining 77 Ethereum at 4730. And my price target is down here at the $2500 level where I will buy all of them back at a lower price. The reason
[01:27] I'm targeting this level is because if you look at the volume profiles on the daily time frame, that's the point of control. That's where price is most comfortable and that's where price is most likely to return to. So, if you're wondering why crypto has been crashing since Monday, I thought
[01:42] it was going to happen a little bit faster, but the markets needed to gather some liquidity at this high range and then go down. Overall, I'm up, so I don't really care that much. One more thing, just so that you understand this, markets move to grab liquidity. That's all they do. They go low to
[01:58] get low prices and they go high to get high prices and people enter and exit at specific levels. If we look at this wedge pattern, price shot up above it, breaking the wedge pattern, grabbing liquidity
[02:10] up here and then cascading down from 4,100 to 1300, sweeping the liquidity below this low right here. Now we've shot up above, sweeping liquidity from these highs. And now we are going back down.
[02:25] I'm assuming after a couple of sweeps like this, we should revert back to the point of control where price feels most comfortable and where the highest volume of this asset was traded, which again was 2500. That's my price target. I'm not Nostradamus, but this is my opinion. I've
[02:41] been doing this for many years. If you guys want to watch the full video on my Ethereum trading this year, it's right here. Thanks so much for watching. We'll see you in the next one.



⚡ Saved you 0h 02m reading this? Transcribe any YouTube video for free — no signup needed.