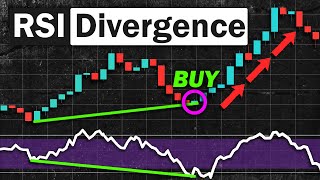

3 Indicators = High Win Rate Strategy
42sQuick introduction to a strategy combining RSI, 200 EMA, and Stochastics grabs attention with promise of high win rate.
▶ Play Clip"Delivers a clear, actionable strategy as promised, though the 'high winrate' claim is unsubstantiated."
This video presents a day trading strategy that combines the RSI, 200 EMA, and stochastics indicators to identify hidden divergences for trend continuation entries. The strategy is designed for forex and stock markets, with a focus on high win rates.
The strategy uses a combination of three indicators: RSI, 200 EMA, and stochastics. The RSI is used to generate entry signals via divergences, not as an overbought/oversold indicator.
A divergence occurs when price and indicator move in opposite directions. For example, price makes lower highs but RSI makes higher highs. There are regular and hidden divergences; this strategy uses only hidden divergences.
Bullish hidden divergence forms when prices make higher lows but RSI makes lower lows, signaling uptrend continuation. Bearish hidden divergence occurs when prices make lower highs but RSI makes higher highs, signaling downtrend continuation.
To make spotting easier, switch to a line chart. Determine the trend using the 200 EMA: if price is above, look for bullish hidden divergences; if below, look for bearish ones.
Identify the latest swing low on RSI, draw a horizontal line at that level and the same swing low on price. Wait for RSI to cross below the line while price hasn't, indicating a higher low in price and lower low in RSI.
Ensure price is below 200 EMA. Identify the latest swing high on RSI, draw horizontal lines at that level and the same swing high on price. Wait for RSI to cross above the line while price hasn't, indicating a higher high in RSI and lower high in price.
Divergence alone is not enough; use stochastics to confirm. For bullish signals, wait for stochastics to cross upwards; for bearish, wait for it to cross downwards.
For buy positions, place stop loss below the nearest swing low and set profit target at 1.5 times the stop loss. For sell positions, place stop loss above the nearest swing high and set profit target at 1.5 times the stop loss.
Demonstrates the complete process: identify trend with 200 EMA, spot hidden divergence, confirm with stochastics, enter, and set stop loss and profit target. Two examples show successful trades.
The strategy provides a systematic approach to trading hidden divergences with confirmation from stochastics, aiming for high win rates. It emphasizes the importance of confirmation and proper risk management.
What is a hidden divergence?
A hidden divergence signals a possible continuation of an existing trend. Bullish hidden divergence forms when prices make higher lows but RSI makes lower lows; bearish hidden divergence occurs when prices make lower highs but RSI makes higher highs.
01:25
How do you determine whether to look for bullish or bearish hidden divergences?
Use the 200 EMA: if price is above the 200 EMA, look for bullish hidden divergences; if below, look for bearish hidden divergences.
03:44
What is the role of stochastics in this strategy?
Stochastics is used to confirm the divergence signal. For bullish signals, wait for stochastics to cross upwards; for bearish, wait for it to cross downwards.
05:21
What is the exit strategy for a buy position?
Place stop loss below the nearest swing low and set profit target at 1.5 times the stop loss.
06:48
What is the exit strategy for a sell position?
Place stop loss above the nearest swing high and set profit target at 1.5 times the stop loss.
06:48
Hidden Divergence Definition
Clarifies the core concept of hidden divergences and their role in trend continuation.
01:25Using 200 EMA for Direction
Provides a simple rule to filter which type of divergence to look for based on trend.
03:44Stochastic Confirmation
Emphasizes the importance of confirmation to avoid false signals.
05:21Risk-Reward Ratio
Sets a clear profit target of 1.5 times the stop loss, defining a favorable risk-reward ratio.
06:48[00:03] high win rate rsi divergent strategy so without further ado let's get on with the video for this strategy i'm using a combination of three indicators the rsi 200 ema
[00:18] and the stochastics but first the main indicator that i want to focus because that will generate our entry signal for the strategy
[00:30] instead of using the rsi as an overbought and oversold indicator divergences so let me give you a quick explanation on what a divergence is during a normal setup if prices are
[00:45] usually the indicator will also follow that same direction in this case the price made higher highs and the rsi also made higher highs however there are instances where the indicator
[00:59] the price instead like in this example the price made lower highs but the rsi made higher highs this is called a divergence there are two types of divergences a
[01:13] regular divergence and a hidden divergence but for this strategy specifically we are only going to be using hidden divergences a hidden divergence is a type of
[01:25] divergence that signals a possible continuation of an existing trend divergences a bullish hidden divergence which forms when prices are making higher lows but the rsi is making lower lows
[01:41] and a bearish hidden divergence which occurs when prices are making lower highs but rsi is making higher highs
[01:53] bullish hidden divergence looks like in this chart we spotted an existing uptrend as prices are heading upwards while the rsi is also heading upwards we can see that the price made a small pullback
[02:07] now if you're looking at this chart with the naked eye you may think that this is signaling a possible trend reversal however if you look at the rsi you can actually spot a bullish hidden divergence
[02:19] as prices made higher lows but the rsi made lower lows this signals a possibility that the uptrend may continue instead uptrend may continue instead and as you can see
[02:33] trend continuation perfectly now let's look at an example of what a bearish hidden divergence looks like in this chart we can see that the price is heading downwards while the rsi is also heading downwards
[02:46] when the price made a pullback to the upside we spotted a bearish hidden divergence as prices made lower highs but the rsi this signals a possibility that the downtrend may continue instead
[03:01] downtrend may continue instead and as you can see the hidden divergence perfectly now of course what i just showed you are just ideal examples when you're trading real time spotting
[03:15] these divergences may be a bit hard so that is why i'm going to show you a identify these hidden divergences in real time to make the price easier to look at you want to switch your chart to a line
[03:30] so the first step is you want to know what kind of divergence are you looking are you looking for a bullish hidden divergence or a bearish one and the way we determine that is by using the 200 ema
[03:44] so if the price is above the 200 ema you only look for bullish hidden divergences and if the price is below the 200 ema you only look for bearish hidden divergences so for this example let's say that the
[03:59] price is above the 200 ema meaning we only look for bullish hidden divergences and this is how you do it the first step is you want to look at the rsi and identify the latest swing low
[04:13] then you place a horizontal line at the swing low of the rsi swing low of the rsi and the same swing low of the price next you want to wait for a setup where the rsi crossed below the line
[04:25] but the price hasn't this shows us that the price is still on a higher low but the rsi made a lower low and so this will be our bullish hidden divergence
[04:37] divergences first you want to make sure that the price is below the 200 ema next you want to look at the rsi and next you want to look at the rsi and identify the latest swing high then
[04:52] you place a horizontal line at the swing high of the rsi and the same swing high of the price next you wait for a setup where the rsi crosses above the line but the price hasn't this shows us that
[05:06] the rsi made a higher high and the price made a lower high and so this will be our bearish hidden divergence remember when trading divergences is you cannot simply take a position
[05:21] just because a divergence appears because it doesn't guarantee that the that is why you need to use another indicator to further confirm your and you can do that by using the stochastics
[05:34] part of the video which is the 200 ema rsi and stochastics combination so this is the first step is you want to look at the position of the price
[05:49] in this case it's above the 200 ema meaning we're searching for bullish [Music] however once you've spotted the you don't want to take any positions yet you need the stochastics to further
[06:04] confirm the signal by waiting for it to cross over upwards once this happens you take a buy position
[06:17] we can see that the price is below the 200 ema meaning we only look for bearish hidden divergences is we want to further confirm the signal by waiting for the stochastics to cross
[06:33] over downwards once this happens you take a sell position [Music] now for your exit strategy if you took by positions you want to place your stop
[06:48] loss below the nearest swing low and set your profit target at 1.5 times your stop loss and if you took cell positions you want to place your stop loss above the nearest swing high and set
[07:02] your profit target at 1.5 times your stop loss so now let's look at the full strategy in action and again i'm going to switch to a line chart to make the price easier to look at
[07:15] so we can see that the price is above the 200 ema divergences and to do that first we want to look at the rsi and identify the nearest swing low next
[07:30] low of the rsi and the same swing low of the price then we want to find a setup where the rsi crosses below the line but the price
[07:42] and so this will be our hidden divergence the next step is we want to further confirm the signal by waiting for the stochastics to cross over upwards once this happens you take a buy
[07:55] position then you place your stop loss below the nearest swing low and set your profit target at 1.5 times your stop loss and as you can see the price hits our
[08:08] profit target and so this counts as a successful trade let's look at another example in this chart we spotted that the price is below the 200 ema meaning we're looking for bearish hidden
[08:21] divergences so first we want to look at the latest swing high of the rsi and place a horizontal line there and the same swing high of the price then we want to wait for a setup
[08:35] horizontal line but the price hasn't and so this will be our hidden divergence and again we want to further confirm the by waiting for the stochastics to cross over downwards
[08:50] position nearest swing high your stop loss
[09:02] and as you can see the price hits our profit target profit target and so this counts as a successful trade
[09:14] that you can immediately use right now and all i ask for in return is for you to invest two seconds of your time into liking the video and subscribe to the channel it literally takes only two clicks
[09:27] but it means so much to me and you can also check out my other videos as well so thank you guys for watching and i'll see you in the next video




⚡ Saved you 0h 09m reading this? Transcribe any YouTube video for free — no signup needed.