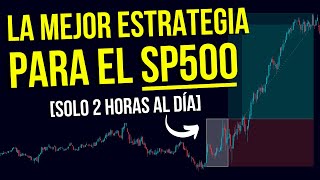

10% Monthly Returns? Trading Strategy Revealed
45sThe promise of high monthly returns (up to 10%) grabs attention and sparks curiosity, making viewers want to learn the secret.
▶ Play Clip"Title promises a profitable scalping strategy for SP500, and the video delivers a detailed, actionable method."
This video presents a trading strategy for the S&P 500 and Nasdaq, aiming for returns of 6-10% per month by trading breakouts during the volatility window around the US market open. The strategy uses an indicator to measure volatility and involves one trade per day with dynamic profit management.
The opening or cash strategy aims for 6-10% monthly returns, with recent periods achieving up to 70%. It measures volatility before, during, and after the US market open to trade breakouts.
One trade per day on S&P 500 or Nasdaq, resulting in approximately 20-30 trades per month.
The indicator parameters are set to input plus two and opening box. For GMT+2, set opening box to 14, 30, 16. The indicator draws a box from one hour before to 30 minutes after the New York market open.
On a 5-minute timeframe, look for fractals (distributive, cumulative, redistributive) occurring in the volatility window. Trade breakouts of these structures.
Wait for the first 5-minute candle to close above or below the range limit. Place a limit trade at the breakout level, stop loss at the opposite end, and initial take profit of 50% at a 1:1 risk-reward ratio.
The remaining 50% is split: 25% taken at the first 5-minute RSI divergence, and the final 25% at the first hourly divergence or significant exhaustion.
After the first 50% take profit, move the stop loss to break even to protect profits.
Trades must be executed within two hours of the cash balance close (6 PM Spanish time) or two and a half hours after the US market open. If not triggered by then, the trade is invalid.
If the range amplitude is very large (e.g., 40-60 points for S&P), consider reducing risk or skipping the trade. This filter is still being tested.
The strategy is traded live daily on SimpleFX, a broker that allows crypto funding with no commissions, only spreads. Links are provided in the description.
The strategy relies on precise timing and dynamic management to achieve high returns. Proper identification of divergences and adherence to time limits are crucial for success.
What is the target monthly return of the opening strategy?
6-10% per month.
00:23
How many trades per month does the strategy aim for?
Approximately 20-30 trades per month.
01:32
What indicator parameters are used for GMT+2?
Input plus two, opening box set to 14, 30, 16.
02:01
What time frame is used to identify fractals?
5-minute timeframe.
03:19
What is the condition for entering a trade?
The first 5-minute candle must close above the upper limit or below the lower limit of the volatility box.
04:30
Where is the stop loss placed initially?
At the opposite end of the range.
04:44
What is the initial take profit level?
50% of the trade at a 1:1 risk-reward ratio.
04:59
How is the remaining 50% of the trade managed?
25% is taken at the first 5-minute RSI divergence, and the final 25% at the first hourly divergence or significant exhaustion.
06:22
When should the stop loss be moved to break even?
After the first 50% take profit is reached.
08:57
What is the time limit for a trade to be valid?
The trade must trigger within two hours of the cash balance close (6 PM Spanish time) or two and a half hours after the US market open.
09:50
High Return Potential
Claims up to 70% returns in recent periods, setting high expectations.
00:23Breakout Trading on Fractals
Introduces a specific method using fractals on a 5-minute chart.
03:05Dynamic Profit Management
Key to strategy's success, using RSI divergences to capture additional profits.
06:22Time Limit Rule
Prevents late entries and maintains discipline.
09:50Volatility Amplitude Filter
Suggests caution with large ranges to manage risk.
12:08[00:01] will be enough to obtain a return of up to 10% per month. Stay tuned because I'll show you everything. [Music]
[00:23] show you the opening strategy, or cash strategy, which basically day (obviously with prior knowledge), to seek returns of between 6 and 10% per month. In recent periods, we've even obtained
[00:37] returns of up to 70%, that is, almost doubling the account. It's basically a strategy where what we do is measure the volatility that occurs before, during, and after the opening of the American market.
[00:51] With that volatility, we measure a range, establish a range with which we will trade on breakouts. Basically, it 's a strategy that includes an indicator that marks a time frame. Now I'm going to explain
[01:05] a little bit about what parameters that time frame must have. And from that trading strategy with an initial, somewhat conservative profit-taking, followed by dynamic management. It's a This strategy involves
[01:20] strategy involves one trade per day, basically on the P500 and Nasdaq. It's true we've had better results on the Nasdaq, but initially, it can be applied to both, giving us one trade per day for the five
[01:32] days a week the American market is open. This means we have the potential to have approximately 20-30 trades per month. This strategy requires the use of an indicator,
[01:46] which we provide below in the video description. Now, I'm going to explain how to configure this indicator. mentioned below in the video description), simply verify
[02:01] that the following parameters are set: input plus two, and opening box. Where it says opening box, we put 14 from 30 to 16 because GMT+2. GMT+2 could be your time zone, but it's
[02:16] simply to avoid confusion. The indicator itself will be set to GMT+2. That's the configuration for your live trade. If you want to use your own time zones, keep in mind that this indicator basically
[02:28] mind that this indicator basically has to draw a box. We have here a timeframe one hour before the opening of the New York market, which is now at 9:30 AM New York time, and up to 30 minutes
[02:40] 9:30 AM New York time, and up to 30 minutes after, because we're using these 14, 30, and 16-minute timeframes. Basically, because most macro data occurs one hour before the opening and up to 30 minutes after, meaning most
[02:53] of the day's volatility develops in that time frame. This allows us to measure that volatility and then, as I mentioned before, look to trade then, as I mentioned before, look to trade on breakouts. Once we have the
[03:05] TradingView, we need to talk a little about how this strategy is used and how the trades are established. As I said, the strategy consists of an indicator or a timeframe that measures
[03:19] volatility at the opening, the opening, and after the opening. Then, on a 5- minute timeframe (it's been tested for that 5-minute timeframe), we look for those fractals—sometimes distributive, sometimes cumulative,
[03:34] redistributive, sometimes rewarding—that occur in those areas, or at least parts of them. occur in those areas, or at least parts of them. Working on the breakout of these structures and the continuation, whether bullish or bearish,
[03:47] is a strategy based on breakout trading. Basically, look, we have the box in this case, measuring the time frame from 2:30 PM to 4:00 PM ( Spanish Peninsula Time, GMT+2). But as I
[04:01] US market opens and up to 30 minutes after. Once we have this volatility window, we establish these limits. We have an upper limit S&P 500, the upper limit is
[04:15] approximately 4,348, and in this example, the lower limit is 332. Once we have this time frame, what we're going to do is wait for time frame, what we're going to do is wait for the first 5-minute candle to close
[04:30] above or below the limit. It's very important that this candle closes breaking the range to the up or down, but that the candle actually closes. Once we have that first 5-minute candle, we place a
[04:44] limit trade at the limit or within the box. where that breakout has occurred, then establish a stop loss at the opposite end and an initial profit take of 50% on the one-to-one ratio.
[04:59] For example, in this case we're seeing here, as you can observe, the breakout occurs on the upper side. So basically, we put the entry point here. We set the entry point once we have the first candle that
[05:12] closes above this one. This one here, for example, didn't close above, as you can see, here we haven't set the limit yet. We basically set the limit from here because this is the first candle that closes above. Therefore,
[05:26] the limit, the limit trade, or a pending trade, has to be there, pending. And this Vera, as you can see, goes down and causes that limit pressure to open. Okay, we have the stop loss at the opposite end of the range. If it's a short,
[05:40] We would put the entry here and the stop loss here, and the initial profit take of 50% of the trade will be on the one-to-one ratio. As trade will be on the one-to-one ratio. As you can see, that would be here. Sorry, that
[05:55] first profit take is, let's say, quite conservative, but that's it. Part of the strategy's foundation is that the initial setup is relatively simple. The important point here, which some of you have probably already
[06:08] noticed, is the management of that remaining 50%. Because managing that remaining 50% will be what makes the difference between difference between acceptable and excellent results. So,
[06:22] how do we manage that remaining 50%? Basically, what we do is divide it into two additional profits. That is, we'll have a total profit in principle. The first take profit, as I mentioned, is
[06:35] 50%. The The next 25% of the
[06:47] initial margin of the trade will be taken when we have the first divergence when we have the first divergence on the explain a little bit about how that works. And the second 25%, to complete
[07:03] 100% and close the entire trade, will be taken when we have the first divergence or at least some significant exhaustion on the significant exhaustion on the hourly chart. As you can see, first 50%
[07:15] on route 11 That's simple. Without the next 25%, we need to put an RSI on the screen. To work with price-RSI divergences, we use a normal RSI with RC-14, a standard 14, without anything
[07:31] RC-14, a standard 14, without anything unusual. What we're looking for is the this specific example, that first five-minute divergence occurs several occur here, all of which are taken into account. The first
[07:45] divergence related to this trek, which we should see here, would occur at first divergence, and there we close the next 25%. That is, in this trade, we would have closed 25% here and the next 25% at this point, in addition to
[08:00] as you can see, would have gone quite well. They were n't quite live. And then, for the next 25%, we'll have to look for it on the
[08:12] hourly chart, looking for that next divergence, that next divergence, or specific case occurred in this flatter trading zone. With the RSI falling, we're closing the next 25%, which would
[08:27] completely end this trade. As you can see, that's the management. This 25% Take Profit from Professor 2 isn't a strict rule; keep that in mind. There are managing in a slightly more dynamic way, and that's fine. In other
[08:43] on the positions each person takes, but these are just small guidelines on how we can manage those next 25% and 25%. One important thing to keep in mind is stop loss management. We haven't
[08:57] discussed that yet. Stop loss management is very simple, and it's as I'm going to explain next: once we've reached the first 50% take profit at the first 50% take profit at ratio 11, we're going to move the stop loss
[09:10] upwards. In this case, since it's a long trade, we'll leave it as a break-even point. That is, we're basically going to save the position in case the trade does n't go forward and returns to the 13th, but it would n't close at a loss, obviously; it would
[09:25] close at a profit. And in fact, this profit... A 50% risk allows us to later because it's a one-to-one ratio. So, as you can see, that still generates profit even if the trade doesn't succeed. Beyond the one-to-one
[09:38] ratio, it obviously generates the peace of mind that we So, as I said, once we reach the one-to-one ratio, the stop loss will go to break even. Another thing you have to keep in mind regarding the
[09:50] basic operation is that the operation has a time limit, and the time limit is the following, colleagues: the trade can only be executed once we have the full cash balance. Obviously, the measurement is one hour before and 30 minutes
[10:03] after the opening of the American market, okay? But also, the trade should only be executed if it occurs within a specific time frame. That specific time frame is two hours from the close
[10:15] of the cash balance in Spanish peninsular time, that is, 6 PM, okay? Two hours from the close of the cash balance, or what is the same, two and a half hours after the opening of the United States market, the Wall Street market. If the trade is
[10:30] not opened by that time, then the trade is not valid. Or there aren't three directly that day; it's not like a stop or a pro. There simply isn't a trade; that basically never existed. There are times when it happens that
[10:43] the breakout occurs later in time, and then at that point, whether the breakout goes later or the test—perhaps the breakout occurs here then the train doesn't open. Okay, both
[10:59] upside, as well as the test, must occur before this time frame. Okay, otherwise the trade is invalid. That's something for you to keep in mind, colleagues. Regarding how to use the strategy, in principle,
[11:15] you have to do good dynamic management, once it's open. As I say, to make the difference between a
[11:27] acceptably and one that works very profitably, correctly identifying these divergences on the 5- hour chart, or even using other elements, is going to be very important to obtain good results in terms of
[11:41] filters, which is something that many, many people probably not to take all three in principle, colleagues, with this strategy we've taking all the trades, as long as they occur
[11:54] time frame we were just discussing, which is actually a standard filter, so to strategy has quite high profit percentages, as I mentioned before. Now, one thing that is important is that if the
[12:08] amplitude, if the amplitude of this volatility range is very pronounced, in the case of the S&P, for example, we can talk about 40, 50, 60 points, very, very pronounced levels like that, there can be a range
[12:23] of 30 or more points. Especially, you have to be careful in those cases. The strategy, which normally works with a 2% risk, which is what we use, could perhaps use a lower risk or perhaps
[12:36] decide not to take that trade. Now, keep in mind that these are filters that we are still testing, and the exact results of forward backtesting with these filters,
[12:50] but approximately for the S&P 500... With amplitudes of more than 30 to 40 points, we might need to be a little more careful and perhaps rely on other analytical and study tools when deciding whether to take credit.
[13:04] Look at this 40-point amplitude, which we have here, reaching 11. But as I said, the higher the amplitude, the better. Perhaps we should be amplitude, the better. Perhaps we should be a little more careful.
[13:17] little bit about where we're doing this. As you know, we're constantly using a live tool from a pretty good broker that allows us to work without cash, with
[13:32] crypto funding. Fund the account with crypto and without commissions, only the spread. In addition, it has WebTrade and MetaTrader, either one you prefer, or MetaTrader SimpleFX. The broker is called SimpleFX; you have the link at the
[13:47] bottom of the video description, and you also have tutorial links so you can see how the platform works. I suggest you try this as I said, we can work without crashing, without confusing crypto, and without commissions.
[14:02] With only small spreads, which, as I said, are quite cheap and any questions you have about the strategy can be left in you know, we're trading this strategy live every day.
[14:16] You can go to the channel and see that we're live every day. You can questions regarding the application of the strategy? You can ask them or in the live streams themselves so you can see how we're handling all of this in real time.
[14:29] Because we also trade this general strategy precisely at the times when we're live at those times so you can join us in the live streams, and do n't forget to like and
[14:43] helps. Thank you very much and see you in the next video.
⚡ Saved you 0h 14m reading this? Transcribe any YouTube video for free — no signup needed.