
AI Summary
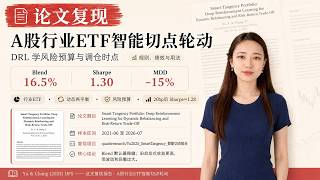
This video presents a backtest study of A-share industry ETF rotation using a smart switching-point combination framework. The research applies deep reinforcement learning concepts, but this backtest uses heuristic proxies instead of full RL training. The default 'Blend' strategy achieves an annualized return of about 16.52% with a maximum drawdown of -15%, demonstrating the framework's potential on Chinese thematic ETFs.
Chapters
The study proposes a switching-point method that uses deep reinforcement learning to simultaneously decide risk aversion and rebalancing cadence. It achieved significant excess returns on US industry ETFs, and this backtest applies it to 12 Chinese thematic ETFs.
The backtest period is from June 2021 to July 2026. The default Blend scheme achieves an annualized return of about 16.52%, a Sharpe ratio of 1.30, and a maximum drawdown of about -15%. After deducting 20 basis points of costs, the Sharpe ratio remains at 1.28.
The strategy always holds full long positions with non-negative weights summing to one. The core metrics are the risk aversion parameter LAMBDA (1 to 100) and the holding period CH (5 to 60 trading days). After the holding period, weights are rebalanced using a mean-variance framework based on rolling 252-day daily returns, supporting MV, MSD, and CVaR utility functions.
The dynamic scheme trades daily, while the static baseline rebalances every 30 days. The dynamic scheme follows the H value from the switching rule. Initial net value is set to 1000, and the risk-free rate is taken as 0. Data sources differ: the original study used Yahoo daily data for US ETFs, while this backtest uses locally stored A-share ETF data.
The backtest uses 12 A-share ETFs covering themes like gold, soybeans, Nasdaq, ChiNext, and new energy vehicles. The benchmark is the CSI 300 plus a defensive ETF. The control group uses heuristic MSV with volatility sleeves or static grids, with no reinforcement learning training. The estimation window is 252 trading days, static rebalancing every 30 days, and dynamic holding periods between 5 and 60 days.
The chart shows net values and drawdowns for each scheme. The default Blend is the most stable, with maximum drawdown around -15%. In contrast, the full portfolio and CSI 300 benchmarks have drawdowns of -33% and -40%, respectively, indicating that thematic diversification alone is insufficient.
The 'Other' scheme has the highest cumulative return but the deepest drawdown at -30%, with volatile net value swings, making it unsuitable as a default. The static switching-point scheme achieves about 17% return with a Sharpe of 1.12 but suffers a -17% drawdown, which is risk-adjusted worse than Blend. Blend's longest underwater period is about 89 trading days.
Blend has the highest Sharpe ratio at 1.30. The MSV-GT scheme has a slightly higher annualized return of 16.97% but a deeper drawdown of -17.53%. The full portfolio only achieves 6.23% annualized with a Sharpe of 0.32, showing that switching-point grids significantly improve risk-adjusted returns.
Blend's annualized turnover is 1.2 times. After deducting 20 basis points, the annualized return drops to 16.2% and the Sharpe ratio to 1.282, a decline of only about 0.02. This indicates the strategy is not a thin-edge strategy that collapses with costs, showing strong real-world tolerance.
Blend's returns are evenly distributed from 2022 to 2025, with interval returns of 10.4%, 11.4%, 1.4%, 17.4%, and 40.6% respectively. In 2026 up to July, it recorded 7.6%. The Sharpe ratio in 2025 was as high as 2.38%, but this strength is not extrapolatable as normal; in 2026 it fell to 0.64%, showing market dependence.
Blend is a half-and-half mix: one half uses the improved dynamic scheme with MSV utility and volatility sleeves, and the other half is the static switching-point improved dynamic with volatility sleeves. The target 18% volatility sleeve and MSV suppress concentration, avoiding the issue of maximum weight averaging 0.73.
The rolling window comparison confirms that similar schemes maintain Blend's drawdown at -15.1%, still leading. The actionable part is clear: use Blend as the default configuration, applying switching-point logic to A-share industry ETFs to obtain risk-adjusted returns with low cost burden.
If real-world impact costs are significantly higher than the 20 basis point assumption, one should prioritize reducing holding concentration or lowering rebalancing frequency rather than directly applying the old heuristic. Two things are absolutely not to be done: treating the old heuristic as a dynamic scheme for live trading (its high returns come with extreme volatility and drawdowns), and equating this proxy's conclusions with the original deep reinforcement learning results without actually running PPO.
Exploring other utility functions like CARA within the volatility sleeve framework is a possible extension, but requires independent validation of robustness. The summary states that the current best executable scheme is Blend with about 16.5% annualized return, Sharpe 1.30, and max drawdown about 15%, even after costs.
The switching-point scheme, when fully applied to the whole portfolio and compared with CSI 300, shows that combining switching points with volatility sleeves or mixing dynamic approaches is more reasonable than using the old heuristic. The old heuristic's high returns cannot be used as evidence of intelligent switching. The improved scheme effectively reduces concentration risk through MSV utility and volatility sleeves, which is the characteristic the dynamic part should have.
This backtest is entirely based on A-share ETF proxies, with no PPO training. Conclusions apply only to this universe and window. Liquidity impact in live trading still needs separate evaluation.
The Blend strategy, combining switching-point logic with volatility sleeves and MSV utility, offers a robust risk-adjusted performance on A-share industry ETFs. However, its results are proxy-based and require careful consideration of costs and market dependence before live deployment.
Mentioned in this Video
💡 Key Takeaways
Blend's Strong Performance
Demonstrates the framework's potential with a high Sharpe ratio and controlled drawdown.
00:30Thematic Diversification Insufficient
Shows that simple diversification fails without active risk management.
02:36Cost Resilience
Indicates the strategy is robust to transaction costs, a key practical consideration.
04:06Blend's Composition
Explains how the strategy achieves stability through a mix of dynamic and static elements.
05:00Cautions for Live Trading
Provides actionable warnings about cost assumptions and heuristic limitations.
05:29Full Transcript
[00:00] 本期带来一项基于智能切点组合框架的A股行业ETF轮动研究 论文提出了用深度强化学习同时决定风险厌恶与调仓节奏的切点方法
[00:17] 在美股行业ETF上取得了显著超额 本回测在12支中国主题ETF上出现 这一框架采用启发式代理
[00:30] 与波动袖套替代完整强化学习训练等 本期为2021年6月至2026年7月 默认的Blend方案实现了盲年化约16.52%
[00:42] 12.1.30% 最大回撤约-15%的进效扣 除20个基点成本后 12股仍达1.28% 上不抗本年级交易 12只A股可交易ETF、覆盖、黄金、豆破、纳指、创业板、新能源车等主题
[01:02] 始终全额多头、权重非负且求和为一 扣略的核心指标解量 它是两个数字 风险厌恶参数LAMBDA在1到100之间 只有CH在5到60个交易日之间
[01:16] 已期满后系统会基于滚动252天的日收益数据 在均值风险框架下解除七等星组合权重 同时支持MV MSD和CV到三种效用函数
[01:32] 日平均适当递进每天都交易 静态基建每30天再平衡一次 动态方案责任规则给出的H值执行条仓 初始净值设为1000计算下始物风险利率取0数据口径这块需要语言文拉开语言文用的是Yahoo每股日线交易12支
[01:53] ISF行业ETF 样本覆盖203到2023年 控制率是训练了余万局的PTO和A2C算法 本回撤的数据源是本季存储的A股ETF钱
[02:08] 付钱日线赤子 换成中国主体与行业ETF 外加一支护身三把一起来做基准 主样本从2021年6月到2026年7月 控制力全部用启发式MSV加波动袖套
[02:22] 或静态网格代理 没有跑任何强化学习训练 因此所有结论仅对本代理与本宇宙负责 估计窗口统一为252个交易日 静态期限30天再平衡
[02:36] 动态持有期在5到60天之间浮动 这张图展示了各方案的净值与回撤 对比默认的LAND走势 最为平稳
[02:48] 最大回撤控制在-15%附近 以全组合合互生300基准的回撤 分别达到-33%和-40% 说明仅靠主题分散本身远远不够
[03:01] 反其他事 虽然累计收益最高 但回撤最深达到-30%净值 伴随系列摆动 不适合直接当做默认配置 开一 区限了路人风格的静态切点棉
[03:14] 棉花约17% Sharp为1.12 却要承受负17%的回撤 风险调整后明显不如Blend Blend的最长水下期约89个交易日
[03:29] 使用时需要提前预期这种阶段性跑速毛收益口径下Blend棉花16.52%Shop 1.301最大回撤负15.2%
[03:42] 在所有方案中Shop最高 Beta MSVGT 18年化略高为16.97% 但回撤也更深达负17.53%
[03:54] 全组合年化仅6.23上 只有0.32 可见切点网格能显著抬高风险调整收益 超成货近似表里Blend的年化走
[04:06] 假设为1.2次扣完20个基点后 年化降到16.2% SARP仍有1.282 仅下滑约0.02 这种厚度意味着它不是那种成本一碰就翻脸的薄边策略
[04:20] 实盘容忍度比较强 看着数据 都能够更清楚地看见收益来源的分布 Blend在2022年到2025年间贡献比较均匀
[04:33] 分别获得10.4% 11.4% 1.4% 17.4% 和40.6%的区间收益 2026年到7月 录得7.6% 破2025年Sharp高达2.38%
[04:46] 这种强度不可外推为常态 2026年Sharp回落至0.64% 就说明了市场环境的依赖 Blend的构成是对半混合 一半是采用MSV效用与波动绣套的改进动态方案
[05:00] 一半是加了波动绣套的电态切点改进动态 通过目标18%的波动绣套和MSV压制了集中度 就起发是最大权重均值高达0.73的问题
[05:13] 由此被规避 转窗口对照也印证了 类似台式Blend回撤保持在-15.1%依然靠前从食材用法来看可做的部分很清晰以Blend为默认配置
[05:29] 运用切点逻辑在A股行业ETF上 获取风险调整收益成本负担轻 可需要谨慎的地方是 如果实盘冲击成本明显高于20个基点的假设
[05:41] 应优先考虑缩短持仓集中度或降低调仓频率 而不是直接套用旧板起发式 绝对不能做的有两件事 一是把旧启发式当作动态方案直接上线
[05:54] 它的高收益伴随着极端波动和回撤 不可持续 二是在没有真正跑通PTO信念之前 就把本代理的结论等同于原文深度强化学习的效果
[06:08] 波动套框架下尝试其他效用 例如CAEER是可以探索的扩展方向 但需要独立验证稳健性 总结来看
[06:20] 当前最优的可执行方案是 Blend 毛年化约16.5% Sharp 1.30% 最大回撤约15% 即便扣除20个基点成本
[06:32] Sharp仍能守住1.28% 开点内方案 全面用于整全 与护身300 准确定开切点叠加波动袖套 或混合动态之后 效果比沿用旧体发射更合理
[06:44] 就提发使得高运级不能当作智能切解 以生效的证据改进方案 通过MSV效应和波动 秀套有效压低了集中度风险
[06:56] 这才是动态部分应该具备的特征 本回测完全基于A股ETF代理 没有训练PTO结论 仅适用于本宇宙与本窗口 石盘落地时流动性冲击
[07:09] 仍需单独评估